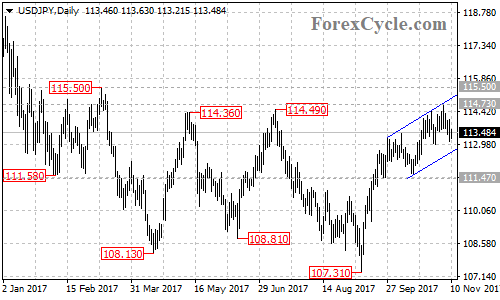
USDJPY’s upside movement from 107.31 extended to as high as 114.73. Near term support is at the bottom trend line of the price channel on the daily chart now at around 112.65. As long as the channel support holds, the uptrend could be expected to continue and a breakout of 114.73 level could trigger another rise to test 115.50 resistance. Above this level could signal resumption of the long term uptrend from 98.97 (Jun 24, 2016 low), then next target would be at 118.66 (Dec 15, 2016 high). On the downside, a clear break below the bottom of the channel could bring price back to test 111.47 support. Below this level will confirm that the upside movement from 107.31 had completed at 114.73 already, then the pair would find next support at around 109.50.