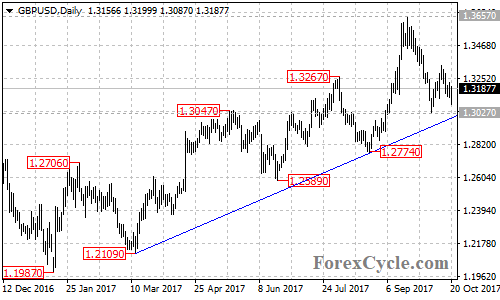
GBPUSD trades above a bullish trend line on the daily chart, suggesting that the pair remains in the uptrend from 1.1946 (Oct 2016 low). As long as the price is above the trend line, the upside movement could be expected to resume and a break of 1.3350 resistance could trigger another rise towards the bearish trend line on its weekly chart. On the downside, a breakthrough the bullish trend line support could take price to next support level at 1.2774. Below this level will confirm that the uptrend had completed at 1.3657 already, then the following downside movement could bring price back towards 1.1946.