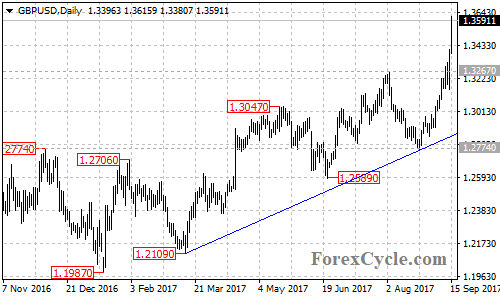
GBPUSD broke above 1.3267 resistance, and extended its bullish movement from 1.1987 to as high as 1.3616, facing the resistance at the bearish trend line on the weekly chart. Near term support is at 1.3145, followed by the bullish trend line on the daily chart. As long as the trend line support holds, the upside movement could be expected to continue, and a clear break above the trend line on the weekly chart could take price to next resistance level at 1.3950. Only a breakdown below 1.3145 support could bring price back towards bullish trend line on the daily chart.