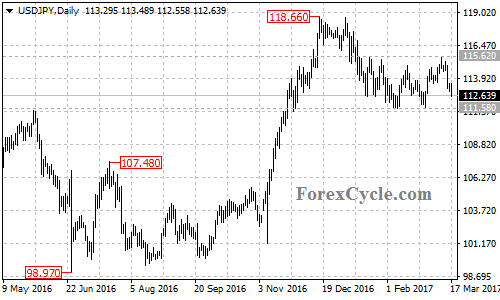
USDJPY failed to break above 115.62 resistance and continued its sideways movement in a range between 111.58 and 115.62. Deeper decline to test 111.58 support would likely be seen next week. A break of this level will indicate that the downtrend from 118.66 has resumed, then the following downward movement could bring price to 108.00 area. Only break above 115.62 resistance could signal completion of the downtrend.