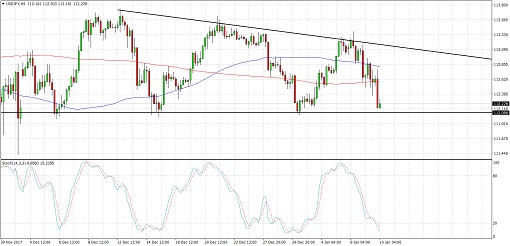
USDJPY is still trading inside its descending triangle pattern and has just bounced off the resistance previously highlighted. Price is now making its way back to support at the 112.00 major psychological level for another test.
The 100 SMA is above the longer-term 200 SMA on the 4-hour time frame, so the path of least resistance is to the upside. This means that a bounce is more likely to happen than a breakdown. Still, a breach of support could lead to a 150-pip drop or the same height as the chart formation.
Stochastic is heading south to show that sellers are on top of their game, but the oscillator is dipping into oversold territory to indicate bearish exhaustion. Turning higher could draw buyers back in and lead to a move up to the triangle resistance near the 113.00 mark.
The BOJ recently surprised the markets by tapering its bond purchases, leading many to believe that the central bank is shifting to a less dovish stance. Weaker than expected data from the US also weighed on the dollar later in the day, but the US currency is able to draw some support from rising equities and bond yields.
Data from Japan came in mixed, with average cash earnings up 0.9% versus the estimated 0.6% uptick and the consumer confidence figure slipping from 44.9 to 44.7 instead of improving to 45.1. US JOLTS job openings and NFIB Small Business Index both disappointed.
Up ahead, US import prices and final wholesale inventories data are due. Traders are likely to keep close tabs on bond yields and stock market performance to gauge if dollar strength can be sustained.
By Kate Curtis from Trader’s Way