
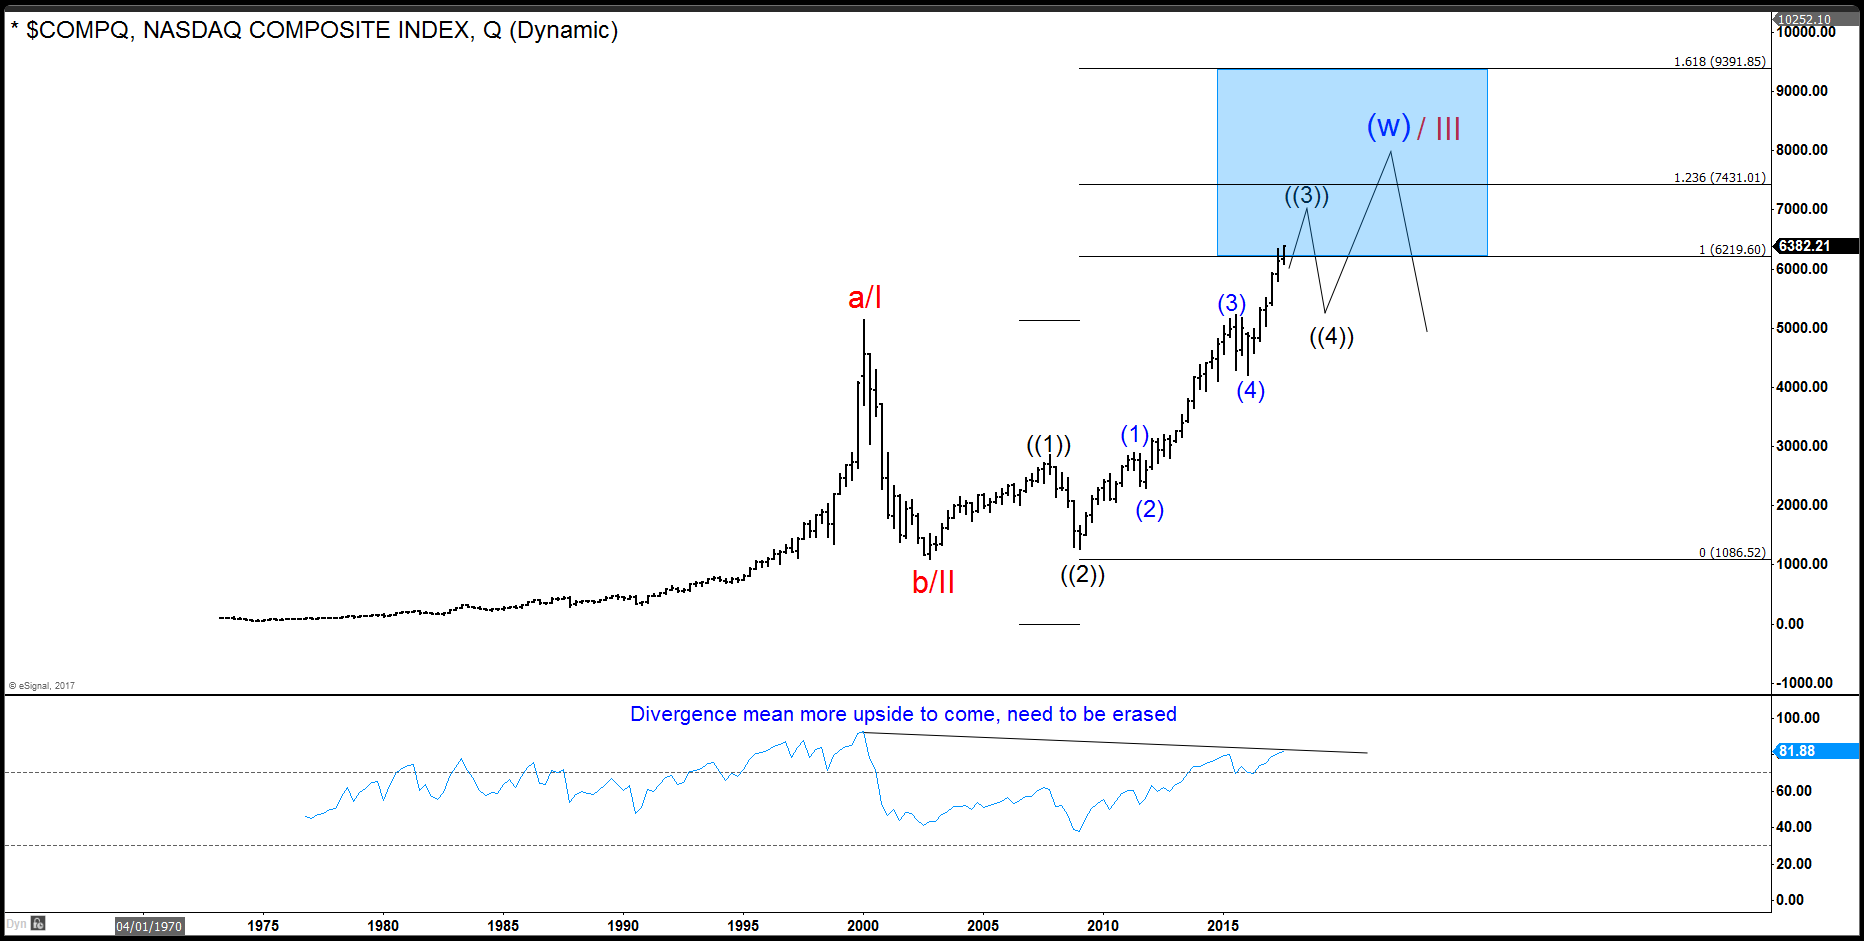
The following chart shows NASDAQ composite index. The index has a tremendous rally since the lows around 1975 which is pretty close to the zero level. The index has reached the bottom of the blue box at 6219 area. The question then is whether the index will extend higher or start correcting lower as the minimal target has been reached. As we often say, Elliott wave theory by itself is not enough. In this case, we can see that from the zero line, we can count the index as a completed ABC. However, we can also count it as an incomplete ABC with a black((4)) still to happen. In the Elliott wave theory, any five waves structure always at one moment is a three wave move. It is therefore too early at this stage to determine if the rally will develop into a five waves move.
In Elliottwave-forecast.com, we have implemented new ideas and tools to make the theory a more reliable tool. We use cycles, sequences, distributions and momentum indicators to increase the accuracy of Elliott wave theory. As we explain in this video, the RSI (Relative Strength Index) indicator is still showing a divergence compared to the peak in 1999. One of the rules that we introduced in the new Eliott wave theory is that a three waves move can not have divergence in any single time frame. Looking at Nasdaq quarterly chart, we can observe the divergence between momentum and price action. Thus, the index still has scope to extend into the areas of 7431 minimal or even reach the 9391 area before the 2009 rally is complete.
The five waves move in blue degree is now about to end. But we feel very comfortable to say that the pullback will be another buying opportunity. It is very easy to trade following our forecast. We always prioritize the trend and we use a distribution system and a series of pivots and cycles to prioritize the trend. In conclusion, even though the index has reached the minimal target, a multi market correlation and simple indicator like the RSI are calling for a pullback soon into a wave four but more upside to follow afterwards.
Long Term Nasdaq Elliott Wave Path
Source : https://elliottwave-forecast.com/stock-market/nasdaq-composite-index-pullback-near