
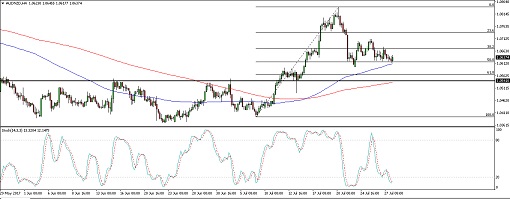
AUDNZD recently broke past the resistance at the 1.0550 minor psychological level then zoomed up to the 1.0800 levels before pulling back. Applying the Fib tool on the latest swing low and high on the 4-hour time frame shows that the 61.8% level lines up with the broken resistance.
The 100 SMA is above the longer-term 200 SMA so the path of least resistance is to the upside. Also, the gap between the moving averages is widening to indicate strengthening bullish pressure. The 100 SMA appears to be holding as dynamic support as well while the 200 SMA is closer to the area of interest.
Stochastic is pointing down to signal that there may be some selling pressure left, but the oscillator is also closing in on the oversold level to indicate potential profit-taking If that happens, buyers could push price back up to the swing high.
Economic data from Australia has not been so upbeat this week, though, as the headline CPI printed a lower than expected 0.2% uptick versus the projected 0.4% gain. Import prices also fell short of consensus for the quarter and hinted of lower price pressures down the line.
Australia just reported a lower than expected quarterly PPI reading of 0.5% versus the projected 0.6% increase, adding to the narrative that inflation could stay subdued and prevent the RBA from tightening anytime soon.
There have been no major reports from New Zealand, leaving the Kiwi at the mercy of market sentiment. This higher-yielding currency usually draws support during risk-on days and tumbles when risk aversion is present.
By Kate Curtis from Trader’s Way