
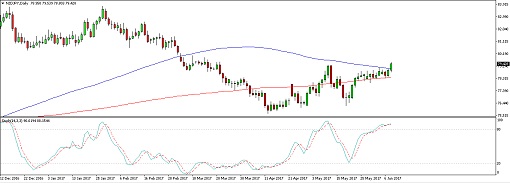
NZDJPY could be in for a long-term climb as it broke past the neckline of its double bottom pattern on the daily time frame. Price was unable to break below the 75.00-75.50 area in its last two attempts and has rallied past the resistance at the 79.00 handle.
This signals that the pair could be in for around 400 pips in gains, which is the same height as the chart formation. The 100 SMA is above the longer-term 200 SMA on this chart but the gap is narrowing to indicate weaker bullish momentum. Note, however, that price already broke past the 100 SMA dynamic inflection point.
Stochastic is also indicating overbought conditions so buyers might want to book profits soon. If so, another move towards the bottoms could take place or at least a quick pullback to the 79.00 mark.
Data from New Zealand has been mostly upbeat this week, particularly when it comes to commodity prices. The ANZ commodity prices index advanced by 3.2% while the GDT auction yielded a 0.6% gain in dairy prices. Quarterly manufacturing sales increased 2.8% versus the 0.3% forecast.
As for the yen, it has been giving up some ground as risk appetite is starting to return. Traders are propping US assets back up and letting go of their long yen holdings as a result. Japan’s final GDP reading was downgraded from 0.5% to 0.3% instead of being upgraded to the 0.6% forecast.
By Kate Curtis from Trader’s Way