
Under pressure by the resistance of the Mar 10 high of 115.50, USDJPY pulled back from 114.36 and the fall extended sharply to as low as 110.23. The pair will find support at around 109.60, which is the 23.6% of the Fibonacci support, taken from the April low of 108.13 to the May high at 114.36.
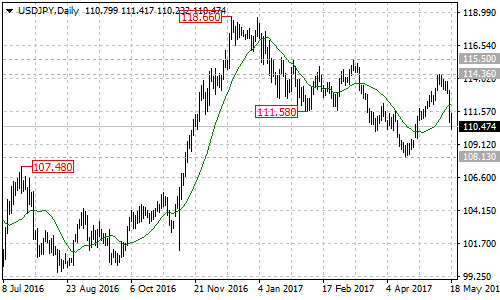
However, as we mentioned two days ago, the downward movement from the December 2016 high of 118.66 had completed at 108.13 already, and the pair is now in uptrend. Another rise could be expected after the current pullback.
The first resistance level is at the 20 moving averages on the daily chart, now at 112.15. A break of this level will indicate that the correction pullback is complete and this could trigger another rise to test 115.50 resistance, a rise through this level will suggest that the long term uptrend from the Jun 2016 low of 98.97 has resumed, and this could take the price to next resistance level of 118.66.
On the downside, if the 23.6% of Fibonacci support gives way, the 108.13 support should be tested, and a breakdown below this level could bring price back to the downtrend from 118.66, then next target would be at around 106.50, which is the 61.8% of the Fibonacci support, taken from 98.97 to 118.66.
Technical levels
Support levels: 109.60 (Fibonacci support), 108.13 (Apr 17 low), 106.50 (Fibonacci support).
Resistance levels: 112.15 (20 moving averages), 114.36 (May 11 high), 115.50 (Mar 10 high), 118.66 (December 2016 high).