

In this Elliott Wave update, we examine the long-term structure in SLB Limited ($SLB). The stock completed a major bullish cycle in 2014 and then entered a multi-year corrective phase. That decline unfolded as a large zigzag correction and eventually bottomed at 11.87 in 2020.
5 Wave Impulse + ABC correction
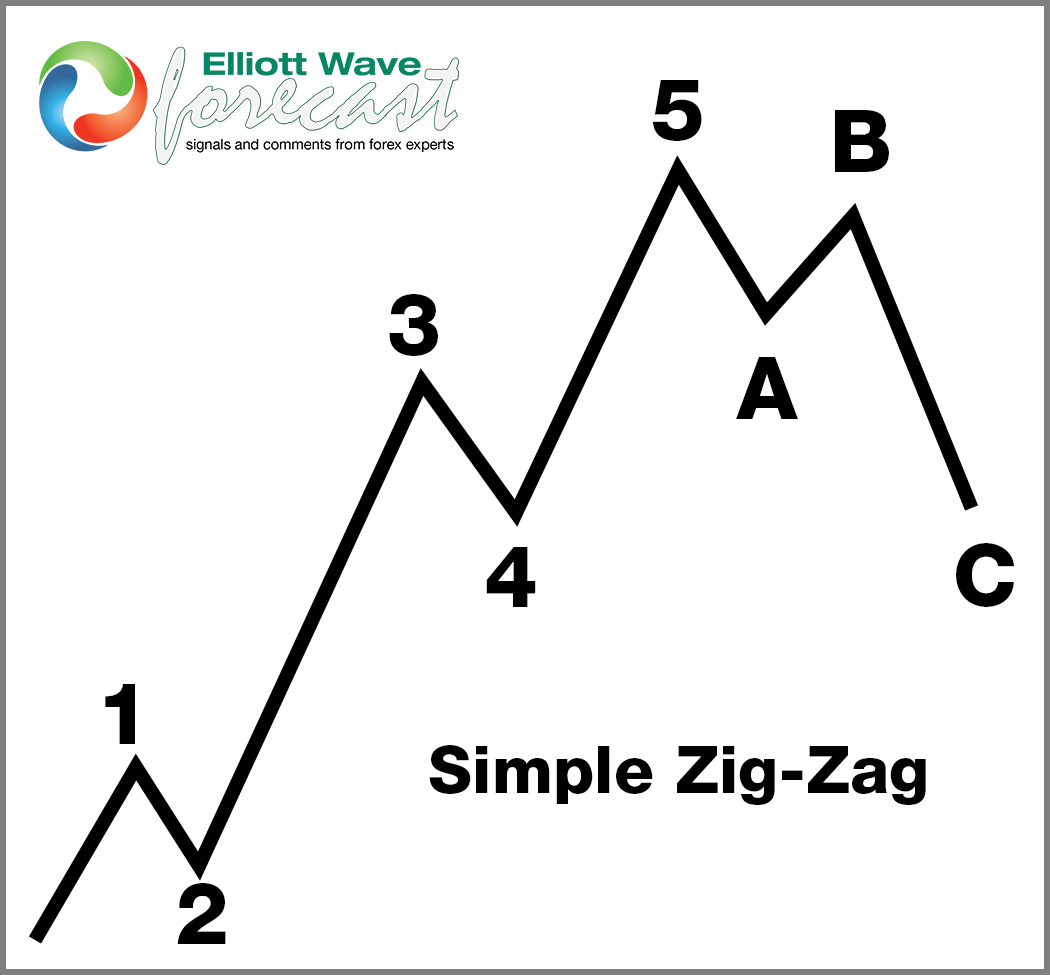
Since that low, $SLB has started a new bullish cycle. More importantly, the Elliott Wave structure has continued to build a series of nested wave 1 and wave 2 sequences. Two nests have already been completed, while a third appears close to finding its low. If this structure continues to develop as expected, $SLB could be preparing for a significant acceleration higher over the next few quarters toward the $81–$113 area.

Major Cycle From 2014 Ended With a Zigzag Correction
Looking at the weekly chart, $SLB reached an important long-term peak in 2014. From there, the stock entered a prolonged bearish correction that lasted several years.
The decline unfolded as a large A-B-C zigzag structure. Wave (A) produced the initial decline, wave (B) delivered a corrective recovery, and wave (C) extended sharply lower into the 2020 low.
That correction finally ended at 11.87, marking an important long-term turning point for the stock.
From an Elliott Wave perspective, the 2020 low completed wave II, opening the door for an entirely new bullish cycle.
First Bullish Nest Formed From the 2020 Low
From the 2020 bottom, $SLB started a strong advance and developed five waves higher. That impulsive move completed wave ((1)), confirming that buyers had regained control of the larger trend.
Afterward, the stock entered a corrective decline that lasted into April 2025. That pullback completed wave ((2)) and formed the first bullish nest.
This is an important feature of the long-term structure. Rather than ending the bullish cycle, the April 2025 decline simply corrected the first impulsive move from the 2020 low.
Second Nest Completed in July 2026
Once the April 2025 correction ended, $SLB started another strong advance.
Again, the rally developed in five waves, completing another wave (1) at a smaller degree. The market then corrected that move and found another important low in July 2026, completing wave (2).
That sequence created the second nest within the larger bullish structure.
At this point, $SLB had established two separate wave 1–2 formations from the 2020 low. This type of nesting often appears before a market enters the strongest part of a third-wave advance.
Third Nest Is Now Looking for a Low
Following the July 2026 low, $SLB rallied again and produced another new high, confirming that the bullish sequence remained intact.
The stock has since entered another short-term pullback. This decline is being counted as another wave 2, creating what could become the third bullish nest from the 2020 low.
Most importantly, this pullback appears to be approaching completion. Therefore, $SLB could find its next important low any day now before the next impulsive leg begins.
As long as the current correction remains supported, the structure should continue to favor the upside rather than a larger bearish reversal.
Why the Triple Nest Matters
A bullish nest forms when the market repeatedly completes wave 1 advances followed by corrective wave 2 pullbacks without invalidating the larger structure.
$SLB now appears to have built:
- First nest: Five waves up from the 2020 low, followed by the pullback into April 2025.
- Second nest: Another five-wave rally, followed by the correction into July 2026.
- Third nest: A new high from the July low, followed by the current pullback that is now searching for completion.
This nested structure can create significant upside acceleration once the smaller-degree wave 2 corrections finish.
In other words, each completed nest increases the potential for multiple third waves to unfold together. That is why the next rally could become substantially stronger than the advances that preceded it.
$81–$113 Becomes the Next Major Target
The larger bullish sequence points toward the $81.81–$113.11 area over the next few quarters.
The lower end near $81.81 represents an important Fibonacci objective, while the upper target near $113.11 corresponds with the 1.618 extension shown on the weekly chart.
Therefore, once the current third-nest pullback completes, $SLB could begin a much stronger phase of the advance.
The move does not need to occur in a straight line. Smaller pullbacks will likely develop along the way. However, the broader Elliott Wave structure suggests that those corrections should remain supported while the larger bullish sequence continues.
Bigger Picture Remains Bullish
The most important point is that the new bullish cycle from the 2020 low at 11.87 remains incomplete.
The stock has already created multiple impulsive advances and corrective pullbacks, while each correction has remained above the larger long-term invalidation level.
Furthermore, the development of three potential nests increases the possibility that $SLB is approaching an acceleration phase.
As a result, the next several quarters could become increasingly important for the stock as the larger sequence begins to mature.
Technical Summary
To summarize, $SLB completed a major long-term cycle in 2014 and subsequently corrected in a large zigzag structure that bottomed at 11.87 in 2020.
Since then, a new bullish cycle has developed:
The first five-wave advance was followed by a correction into April 2025, creating the first nest. Another five-wave advance then corrected into July 2026, forming the second nest. From there, $SLB made another new high and is currently pulling back in what appears to be a third nest.
That latest correction looks increasingly mature and could find a low soon.
Once it does, the combination of multiple nested bullish sequences can set the stage for a significant acceleration higher over the next few quarters, with the next major target coming within the $81–$113 area.
As long as the bullish structure remains intact above the larger 11.87 invalidation level, the right side continues to favor higher prices.