

In this Elliott Wave update, we examine the latest structure in Caterpillar Inc. ($CAT). The stock completed a powerful 5-wave advance from the April 2025 low, which ended the bullish cycle into the 2026 peak. Since then, price has turned lower and is now correcting that entire advance.
5 Wave Impulse + 7 Swing WXY correction
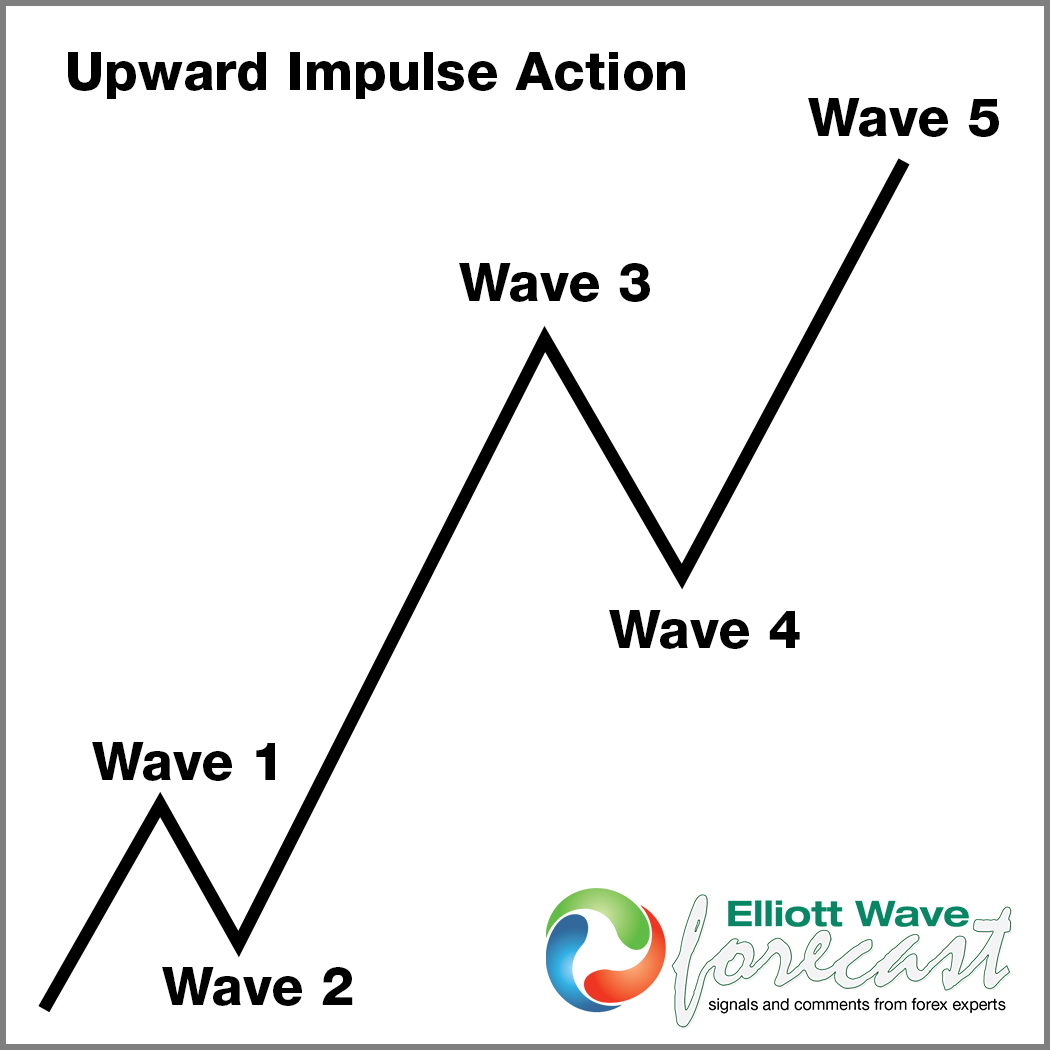
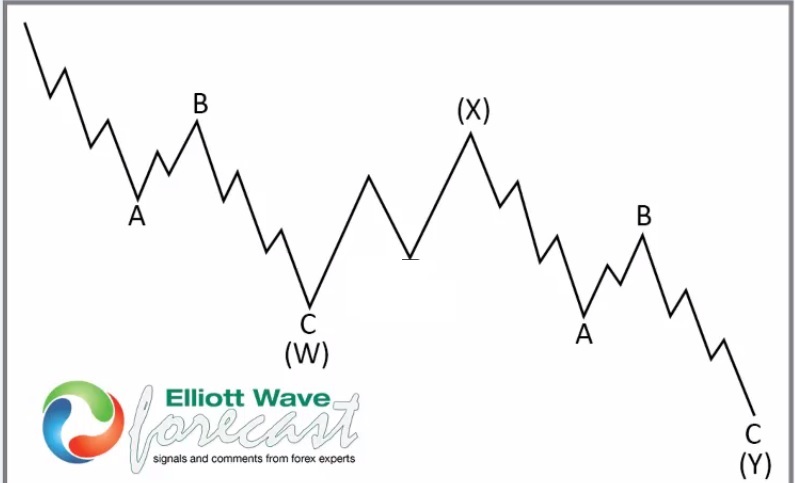
The current decline is expected to unfold in a 7-swing W-X-Y structure. Therefore, although temporary rebounds can occur along the way, the correction likely needs additional downside before the next major bullish opportunity develops. The key area to watch comes at the 640.56–458.44 Blue Box Area, where buyers are expected to enter and the next long opportunity should appear.
$CAT Completed 5 Waves From the April 2025 Low
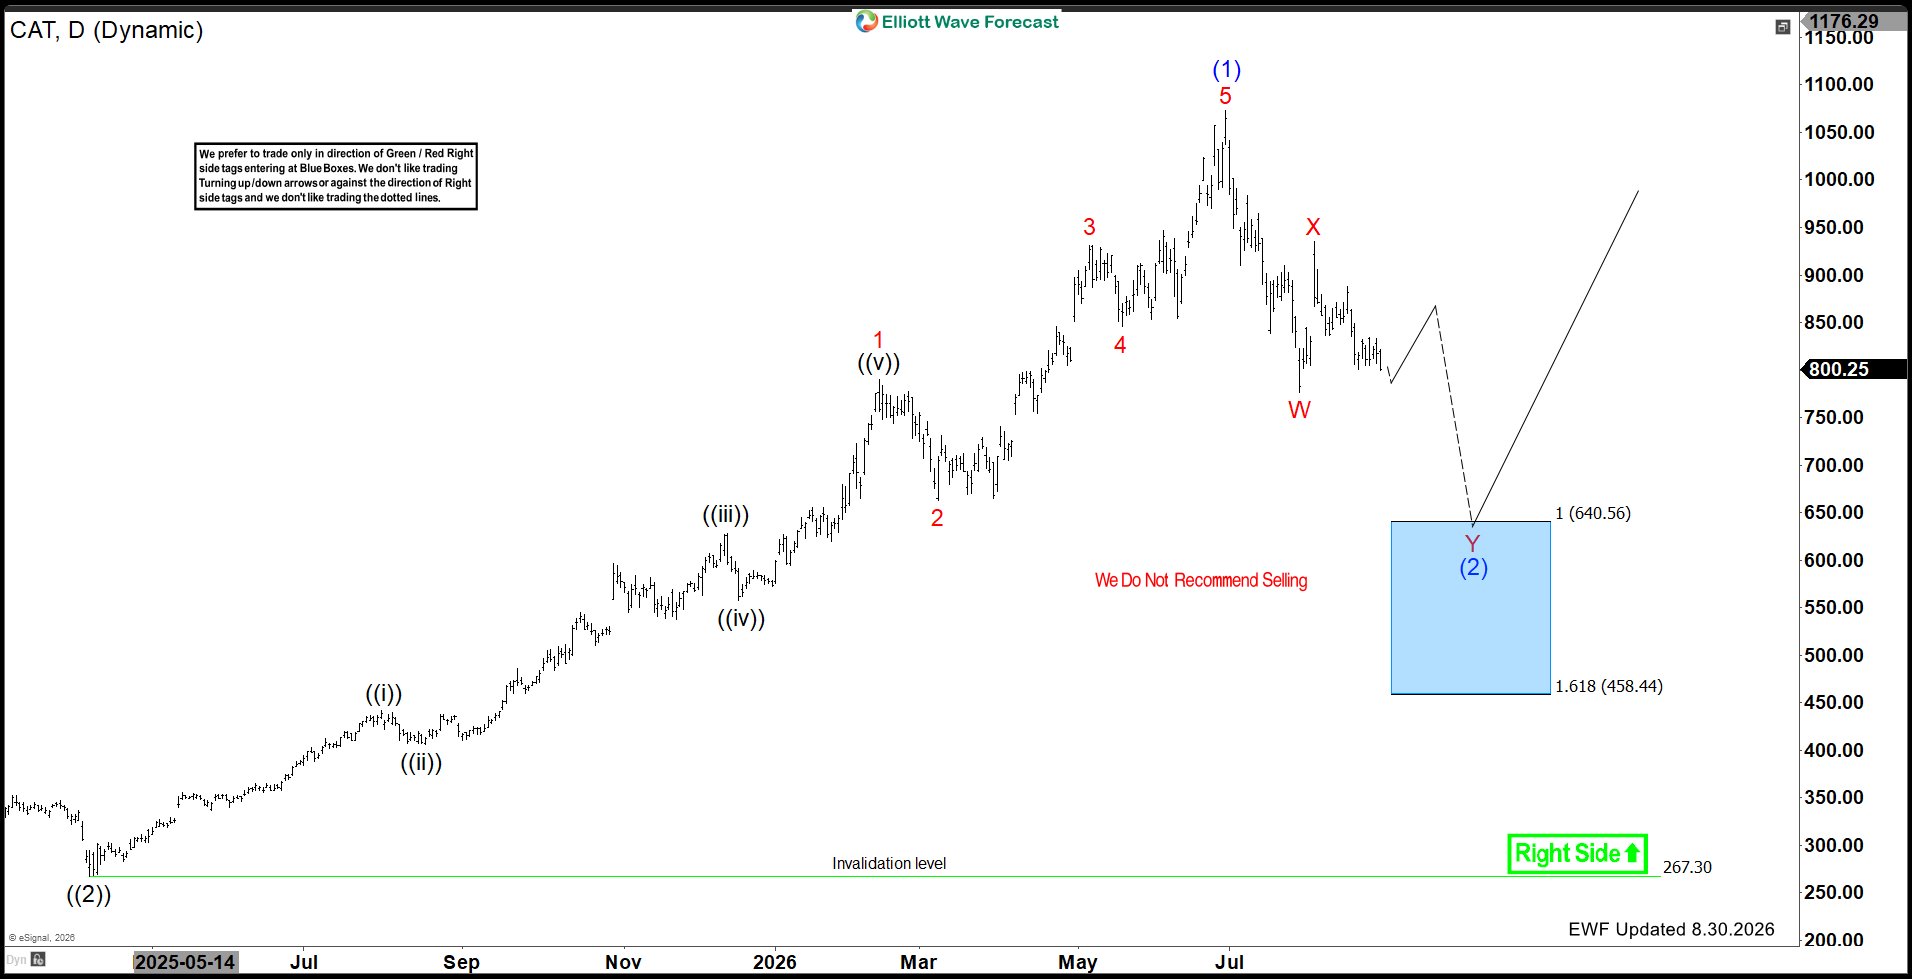
Looking at the daily chart, $CAT established an important low in April 2025 and then began a strong impulsive advance.
The rally developed through a clear sequence of five waves. Waves 1 through 4 built the bullish structure before wave 5 eventually extended into the 2026 high. Consequently, the advance from the April 2025 low can now be counted as a completed 5-wave impulse in wave (1).
Once a five-wave cycle ends, Elliott Wave theory calls for a correction against that entire advance. That corrective process now appears to be underway.
Correction Is Developing as a 7-Swing W-X-Y Structure
Rather than expecting a simple straight-line decline, the current structure favors a more complex 7-swing correction labeled W-X-Y.
The first decline is being counted as wave W. From there, $CAT produced a corrective recovery in wave X before sellers returned for another leg lower in wave Y.
This sequence would complete the larger wave (2) correction against the April 2025 low.
Therefore, a short-term rally should not automatically be interpreted as the beginning of a new bullish cycle. Instead, another decline can follow after.
Blue Box Area Marks the Next Long Opportunity
Most importantly, the projected wave Y decline points toward the Blue Box Area between 640.56 and 458.44.
This zone represents the 100%–161.8% Fibonacci extension of the corrective sequence and stands out as the next high-frequency reversal area.
As $CAT approaches that region, selling pressure should begin to fade and buyers can start looking for the next long opportunity. For that reason, we do not favor selling once price reaches the Blue Box.
Instead, the preferred strategy will be to look for a bullish reaction from 640.56–458.44 in anticipation of the next larger advance.
Short-Term Bounces Can Occur First
Before the Blue Box is reached, $CAT can still produce a meaningful rebound to correct wave X. The chart allows for a recovery from current levels before the larger correction resumes.
However, as long as the W-X-Y structure remains incomplete, that rally should be viewed as corrective.
Once the bounce ends, another decline in wave Y can take $CAT toward the projected Blue Box support area and complete wave (2).
Larger Bullish Structure Remains Intact
Although $CAT is currently correcting, the larger picture remains constructive.
The decline is expected to correct the powerful 5-wave advance from April 2025 rather than reverse the entire long-term bullish trend. Once wave (2) completes, the stock can begin the next major bullish cycle.
The broader bullish structure remains valid above the 267.30 invalidation level. Therefore, the larger right side continues to favor higher prices once the current correction finishes.
Technical Summary
To summarize, $CAT has completed a 5-wave bullish cycle from the April 2025 low and is now correcting that advance.
The preferred Elliott Wave structure calls for the pullback to unfold in a 7-swing W-X-Y correction. Most importantly, the 640.56–458.44 Blue Box Area represents the next major support zone and the area where the next long opportunity awaits.
Once the 7-swing correction completes there, buyers can look for the larger bullish trend to resume.