

BITO ProShares Bitcoin ETF (NYSE: BITO) dropped 82% since its 2021 launch. It also showed persistent divergence from Bitcoin’s price action in recent two years. The ETF failed to make new highs in the last cycle and it even peaked earlier in 2024 before dropping 76%. In today’s article, we review the technical Elliott Wave structure currently unfolding. Our analysis explains the potential bullish path tied to Bitcoin’s recent surge.
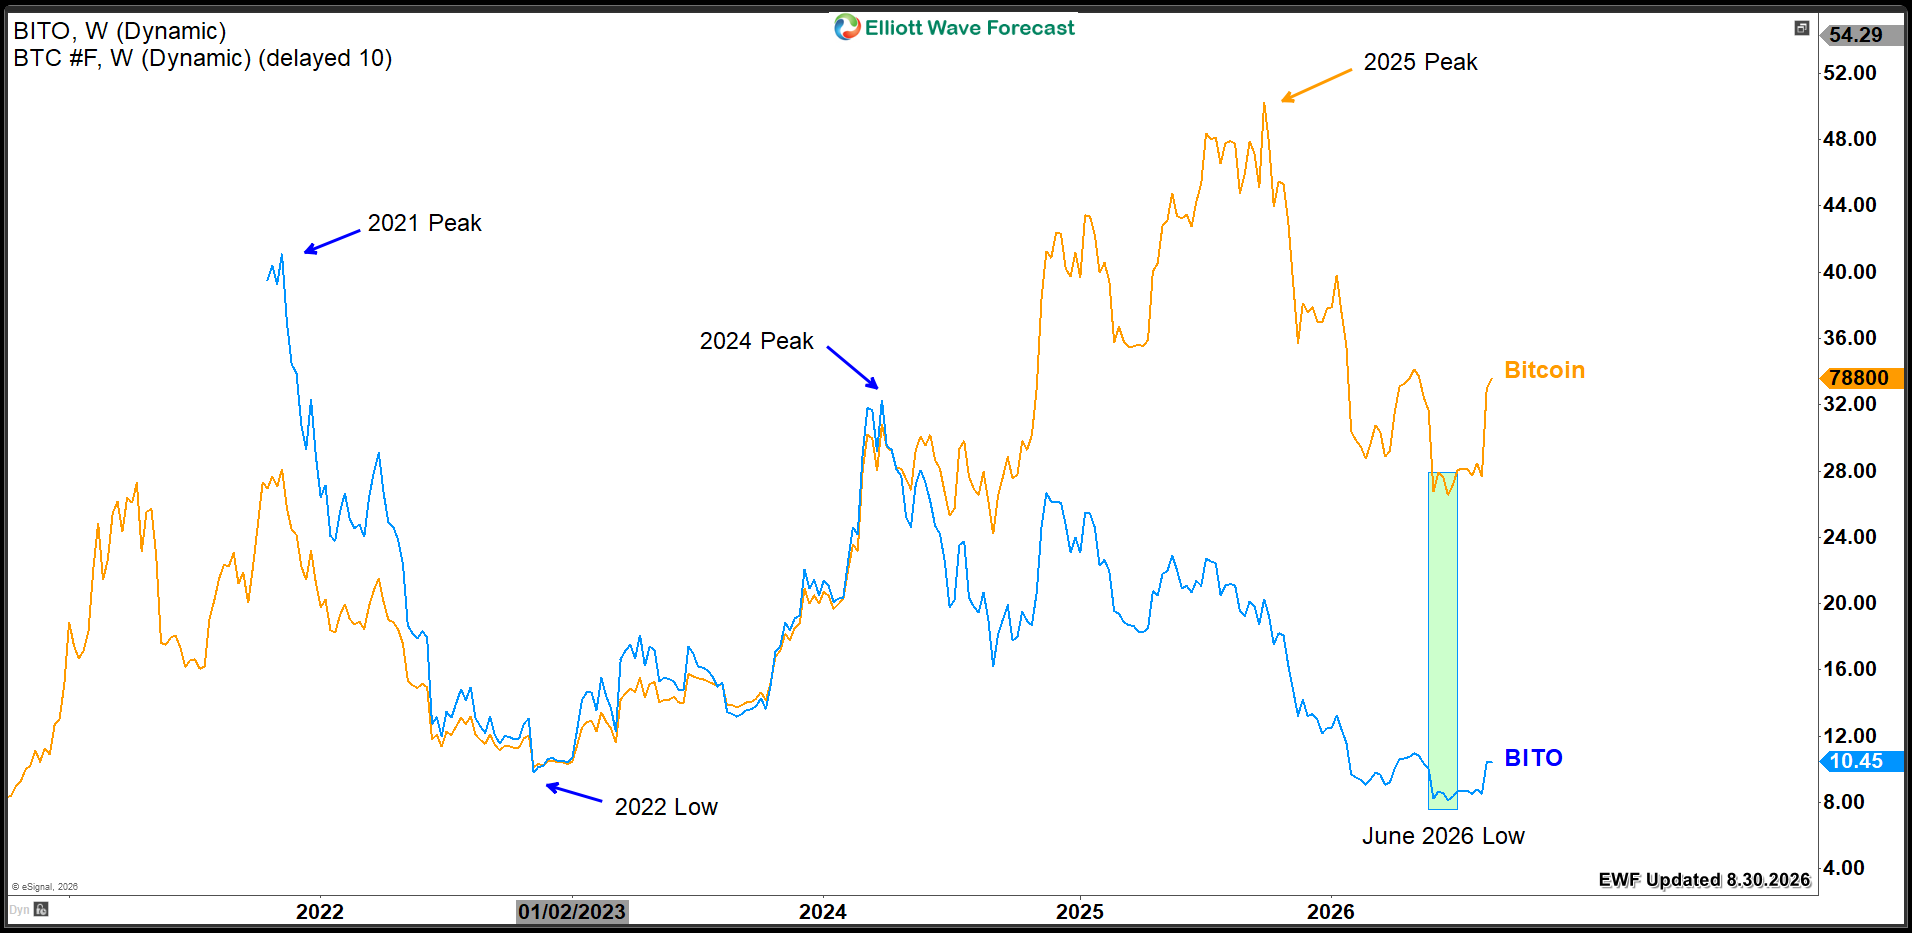
The weekly chart overlays BITO and BTC to compare their cycle oscillations. Since BITO’s 2021 launch, they shared a clear positive correlation. They moved together in both highs and lows until the 2024 peak. Then, a divergence emerged in the magnitude of their moves. Bitcoin continued rallying to new all-time highs, peaking in October 2025. Meanwhile, BITO remained within a sideways range. Then, both started dropping together in the recent bear market until June 2026.
BITO VS Bitcoin
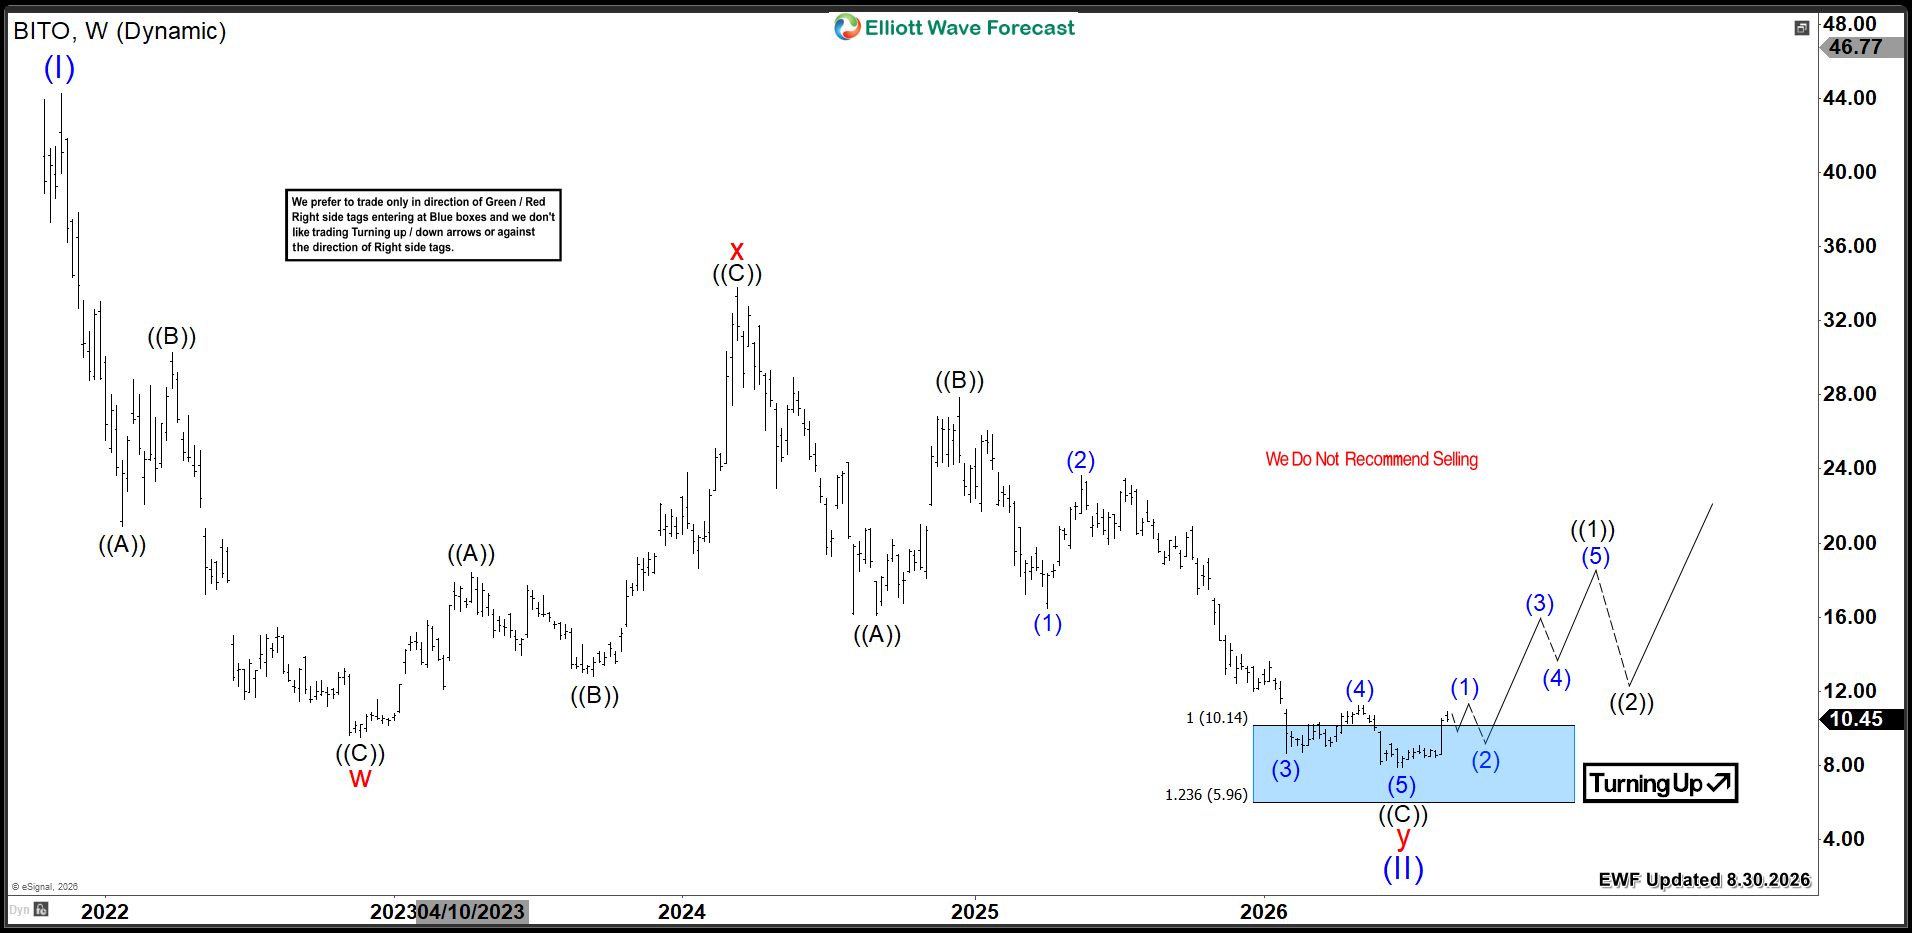
From its 2021 peak, BITO declined within a seven-swing structure. This pattern is labeled as a double three (W-X-Y). The internal Y leg consists of a zigzag three-wave structure (A-B-C). Most importantly, the price decline reached the $10.14 – $5.96 measured equal legs. This area appears as the Blue Box zone on our chart.
This extreme area is designed to identify a potential reversal zone. The market should react here as buyers enter looking for the next bullish cycle to begin from this level. Consequently, we expect BITO to build an impulsive structure over the coming months. This should occur from the Blue Box area. Bitcoin’s price must also hold the summer low to support this move.
BITO Weekly Chart 8.30.2026
Source: https://elliottwave-forecast.com/video-blog/bitcoin-etf-bito-blue-box/