

The long-term advances in the Dow Jones and Copper cannot be correctly labeled as regular Elliott Wave impulses. The reason is based on one of the most important rules within Elliott Wave Theory: Wave 4 of a regular impulse cannot overlap the price territory of Wave 1 at the same degree. This overlap is visible in both markets.
In the Dow Jones, the advance from the 2009 Wave ((II)) low contains overlapping price action that prevents the entire rally from being counted as a regular five-wave impulse. Copper presents the same structural condition in its advance from the 2011 cycle. Rather than suggesting that these bullish cycles are approaching completion, the overlap points toward a much more powerful interpretation: both markets are developing Elliott Wave nests.
That distinction is extremely important because a nest represents a sequence of first and second waves at different degrees. Once those structures are completed, the market normally enters the most powerful portion of the Elliott Wave sequence—an acceleration through multiple third waves.
Why the Overlap Matters
A regular bullish impulse follows a five-wave sequence below:
Wave 1 advances.
>Wave 2 corrects Wave 1.
>Wave 3 produces another advance.
>Wave 4 corrects Wave 3.
>Wave 5 completes the impulse.
One of the essential rules governing this structure is that Wave 4 cannot overlap the price territory of Wave 1. When that overlap occurs, the proposed regular impulse becomes invalid at that degree, unless the market is forming a diagonal. This is precisely why the long-term advances in the Dow Jones and Copper should not be treated as simple or nearly completed impulses. The overlapping swings indicate that these markets are developing through a sequence of nested impulses and corrections.
What might initially appear to be Waves 1, 2, 3, 4 and 5 of a single impulse is better understood as a series of first and second waves at progressively smaller degrees. Thus, instead of: 1–2–3–4–5, the structure is developing more like: ((1))–((2))–(1)–(2)–1–2 This is the anatomy of a bullish Elliott Wave nest.
The Dow Jones Nest from the 2009 Low
The Dow Jones established a major long-term low in 2009, ending Wave ((II)). The advance from that low has remained bullish, but the internal overlapping prevents us from labeling the entire move as a regular impulse approaching its conclusion. The correct interpretation is that the Dow Jones has been building a succession of first and second waves.
Each correction has maintained the larger bullish structure and created another base from which the next advance could begin. The 2020 decline ended another important Wave II within the larger sequence, while the subsequent corrections have continued developing the nested structure.
The weekly chart shows the market advancing through several degrees of first and second waves. The correction into the 2026 low completed another Wave (2), and the Dow Jones has already resumed the bullish sequence. This means the market is not simply advancing within a late Wave 5. Instead, it is moving through the early stages of a much stronger phase of the long-term bullish cycle.
The next important pullback should remain corrective and be followed by another extension higher. As long as the important pivot at 36,860 remains intact, the bullish sequence remains valid, and we do not recommend selling the Dow Jones.
Dow Jones Weekly Chart
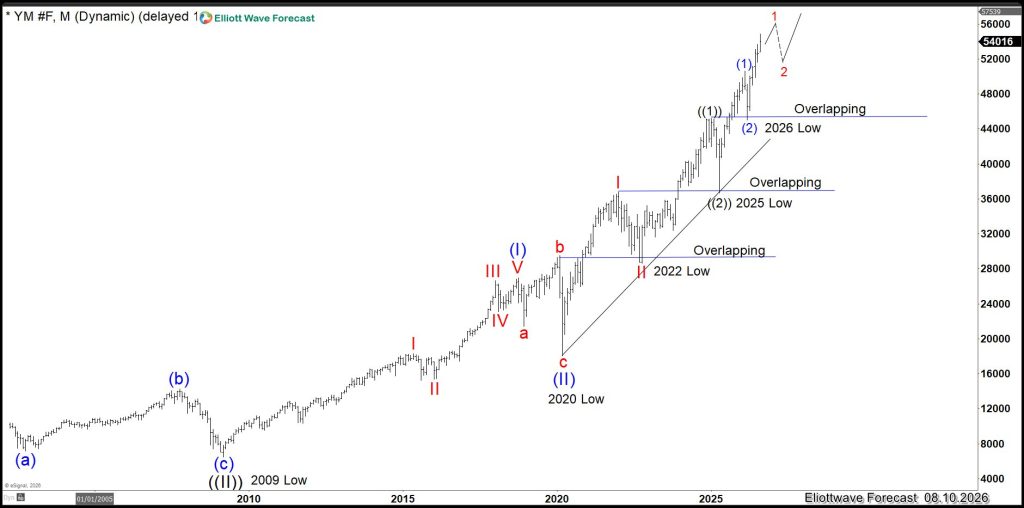
The overlapping structure from the 2009 Wave ((II)) low invalidates the interpretation of a regular impulse at that degree. The sequence is better counted as a bullish nest, supporting additional acceleration.
Copper Is Displaying the Same Bullish Structure
Copper has been developing a similar long-term sequence since its 2011 cycle.
The decline into the 2020 low completed Wave ((II)), and the advance that followed has unfolded through a series of nested first and second waves. The internal overlap means the move cannot be counted as one regular impulse at the larger degree. Following the 2020 low, Copper completed Wave ((1)) and corrected in Wave ((2)). From there, the metal continued higher through another sequence of Waves (1) and (2), followed by smaller-degree Waves 1 and 2.
This creates a powerful bullish nesting formation. Copper is now advancing within the developing third-wave sequence. The weekly structure suggests that the current cycle still has additional upside before completing Wave ((1)). After that cycle ends, a corrective Wave ((2)) should create another major buying opportunity before the next acceleration higher.
As long as the 3.1230 pivot remains intact, the long-term bullish sequence remains valid. Consequently, we do not recommend selling Copper.
Copper Weekly Chart
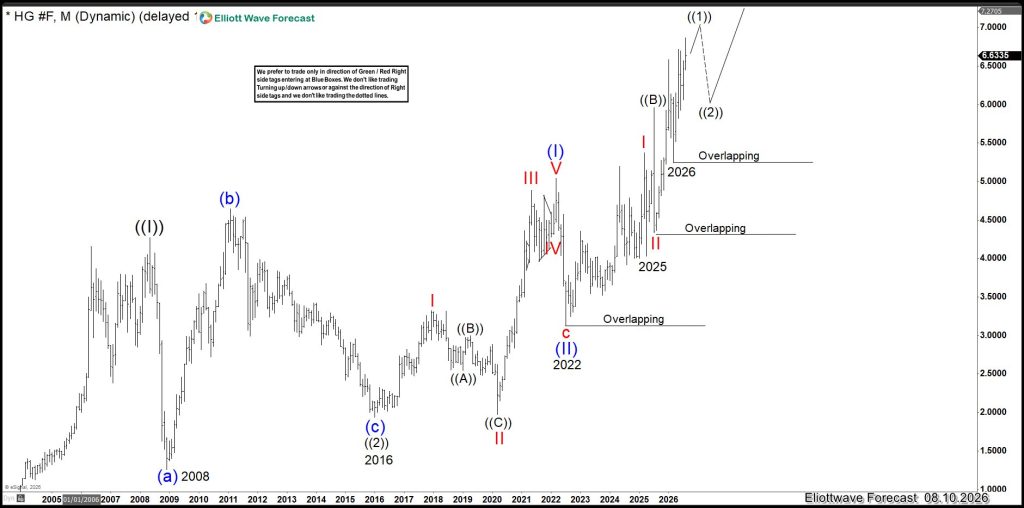
Copper’s overlapping advance supports a nested Elliott Wave structure rather than a regular impulse. The sequence favors additional upside and another acceleration after the next corrective pullback.
Two Major Markets Are Confirming the Same Message
The importance of this setup becomes even greater because the same structural pattern is visible in two markets with a strong connection to global economic activity. The Dow Jones reflects the long-term behavior of major U.S. companies and the broader appetite for equities. Copper is one of the most important industrial metals and is closely connected to construction, manufacturing, infrastructure, electrification and global growth.
When the Dow Jones and Copper both display bullish nested structures, the message extends beyond two individual instruments. Together, they indicate that the larger Risk-On cycle remains incomplete.
Both markets are showing:
Long-term bullish sequences.
Overlapping advances that invalidate regular impulse counts at the larger degree.
Multiple first- and second-wave structures.
Important bullish pivots holding below the market.
The potential for acceleration through a series of third waves.
This synchronization supports the view that the next stage of the market should not be a normal or gradual advance. It should become increasingly powerful as the nested structures begin releasing their third-wave energy.
Why the Nest Points Toward Acceleration
A nest often develops before the strongest part of an Elliott Wave cycle. It can remain overlapping and frustrating for an extended period because the market continues producing first waves followed by corrective second waves. However, every completed Wave 2 creates the foundation for another Wave 3.
Once the corrections end, several third waves can unfold simultaneously at different degrees. This is when momentum expands, participation broadens and price begins advancing much faster.
The sequence can transition from: ((1))–((2))–(1)–(2)–1–2 into: ((3))–(3)–3
That is the source of the expected acceleration.
The overlapping price action is therefore not a sign of structural weakness. It represents the process of building energy before the market enters the strongest phase of the bullish sequence.
What This Means for Risk-On Markets
The bullish nests in the Dow Jones and Copper support a powerful conclusion: the broader Risk-On cycle is preparing to accelerate.
The Dow Jones is pointing toward higher equity prices, while Copper is confirming strength in the industrial and commodity side of the global market. When these two major instruments accelerate together, the movement should support a broad expansion across Risk-On assets.
This environment should favor:
Global equity indices.
Industrial sectors.
Commodities and metals.
Cyclical assets.
Risk-sensitive currencies.
Other instruments correlated with global growth.
Corrections will still occur because markets never move in a straight line. However, those pullbacks should be viewed within the context of the larger bullish sequence. As long as the important invalidation levels remain intact, corrections are expected to produce buying opportunities rather than major long-term selling opportunities.
Conclusion
The overlapping structures in the Dow Jones since the 2009 Wave ((II)) low and in Copper since the 2011 cycle cannot be ignored. Under the rules of Elliott Wave Theory, the overlap between Waves 1 and 4 invalidates the idea that these advances are regular impulses at that degree. Instead, the price action reveals a series of nested first and second waves.
This interpretation completely changes the long-term outlook. Rather than approaching the end of their bullish cycles, both markets appear to be preparing for the strongest phase of their advances. Once the remaining corrective structures are completed, several third waves should begin unfolding at different degrees, creating a powerful acceleration higher.
The Dow Jones represents strength in equities, while Copper reflects industrial demand and expectations for global economic growth. When both markets confirm the same nested bullish structure, the message extends across the entire financial system.
Corrections will continue to occur, but they should remain temporary buying opportunities as long as the major bullish pivots hold. The larger sequences remain incomplete, and selling against them carries significant risk.
The conclusion is clear: the overlapping price action is not evidence that the advance is ending. It is evidence that the market has been building a powerful bullish nest. As that nest begins to accelerate through its third-wave sequence, the Dow Jones and Copper should move substantially higher—and the broader Risk-On environment could explode with them.