Hello fellow traders,
In this technical article, we will take a look at the Elliott Wave charts of the IWM ETF , recently shared with our members. The market completed a clear 3-wave corrective move from the recent peak and found support precisely within the Equal Legs area. In the following analysis, we break down the structure and outline the trading opportunity.
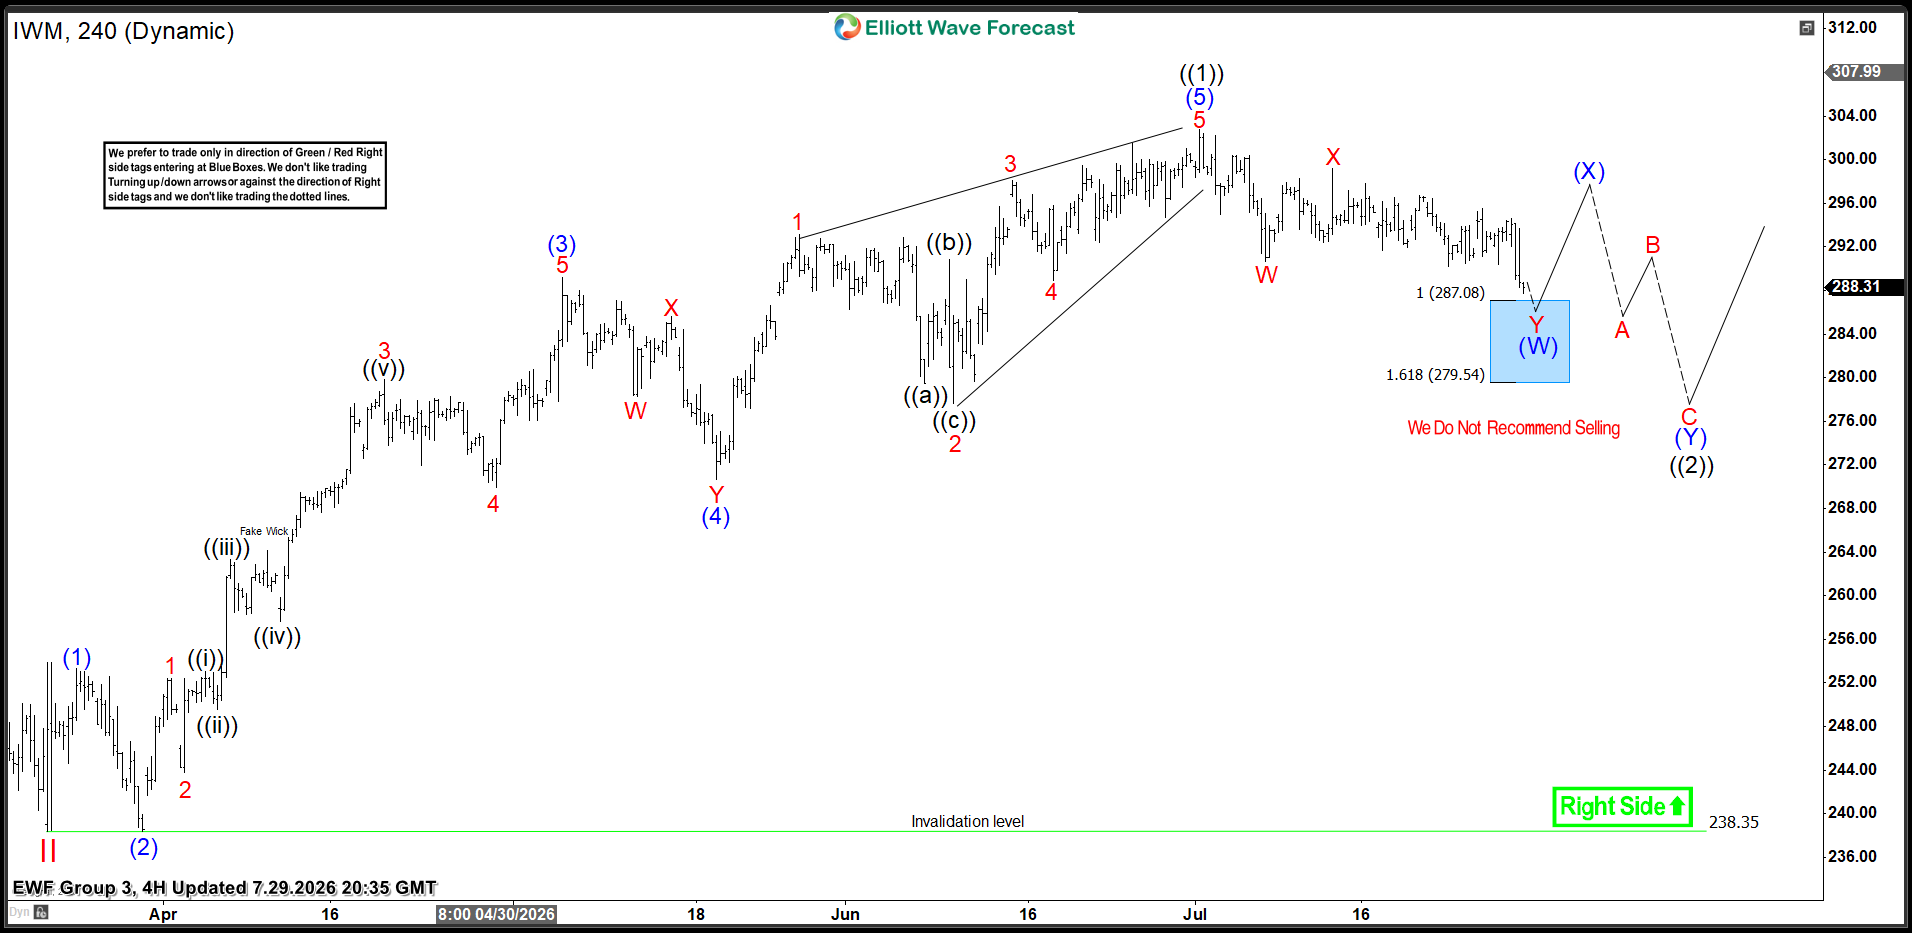
IWM Elliott Wave 4-Hour Chart 07.29.2026
IWM is showing a textbook 3-wave correction from the peak. The price is reaching the extreme area (Blue Box / buyers’ zone) at 287.08–279.54. At this stage, we do not recommend selling and continue to favor the long side from the marked area. From this zone, we expect the ETF to produce at least a 3-wave bounce or resume the bullish trend toward new highs. Once the bounce reaches the 50% Fibonacci retracement against the X red high, we adjust the position by moving the stop loss to breakeven and securing partial profits.
The current structure suggests the first leg of the pullback is close to completion. However, the broader outlook remains bullish, and the Blue Box continues to provide a high-probability trading setup.
Our strategy allows us to enter positions in the extreme area and quickly reduce risk as the market reacts, turning trades risk-free as soon as the expected bounce develops.
Official trading strategy on How to trade 3, 7, or 11 swing and equal leg is explained in details in Educational Video, available for members viewing inside the membership area.
How to Read Our Charts
- Red bearish stamp + Blue Box = Selling setup
- Green bullish stamp + Blue Box = Buying setup
- Black stamp = No trade zone
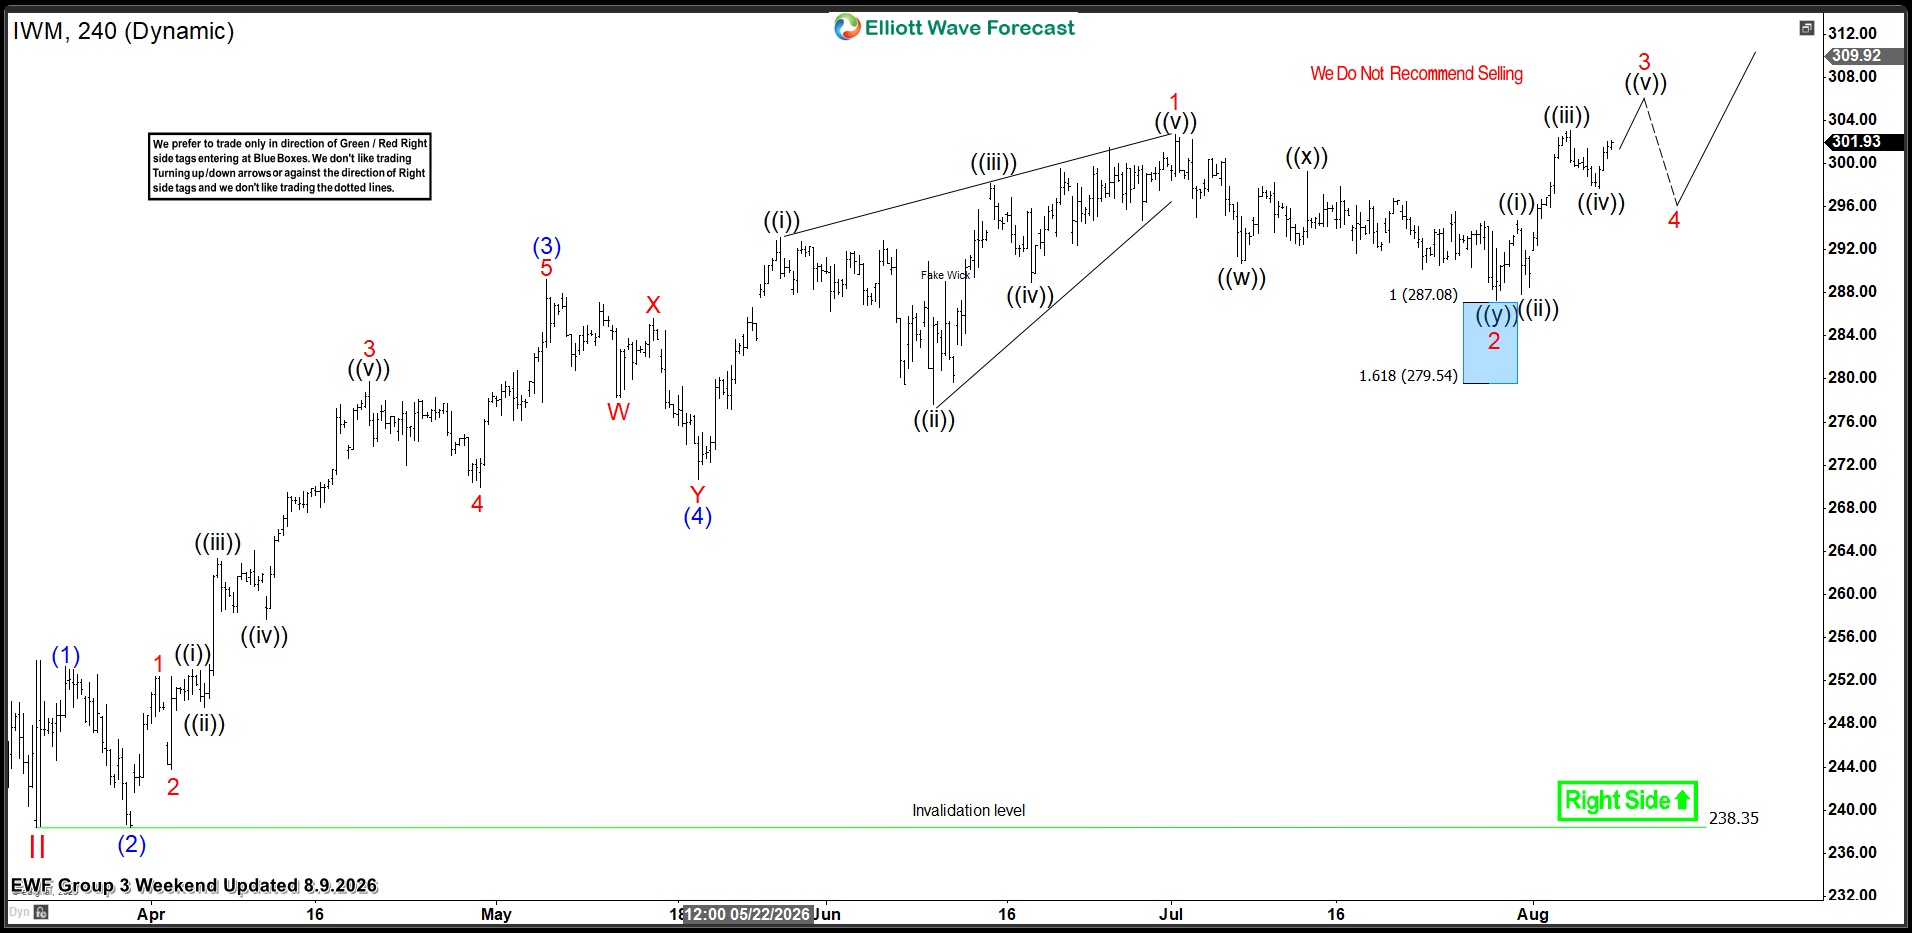
IWM Elliott Wave 4-Hour Chart 08.09.2026
IWM found buyers right at the Equal Legs zone(287.08) and produced a strong reaction from the Blue Box area. As a result, any long positions taken from this zone should now be risk-free.
The ETF has since broken to new highs, confirming that the next leg higher is in progress. We continue to view IWM as a buy on dips and do not recommend selling it during any proposed pullback.
You can check the latest charts and target levels in the membership area of the site. The best instruments to trade are those with incomplete bullish or bearish swings. These are listed in the Sequence Report, and the best ones are shown in the Live Trading Room.
Keep in mind that the market is dynamic, and the proposed view may have changed in the meantime. Our member chat rooms are open 24/7 and provide ongoing expert guidance on market trends and Elliott Wave analysis. Members are encouraged to ask questions about market structure and technical setups at any time