

Hello fellow traders. In this technical block we’re going to take a quick look at the Elliott Wave charts of AMD stock published in members area of the website.
Recently, AMD completed a three-wave structure from the peak, which could be the first leg of a deeper correction unfolding as a seven-swing pattern. In the following analysis, we will examine the Elliott Wave structure in detail and discuss the potential market outlook from this support zone.
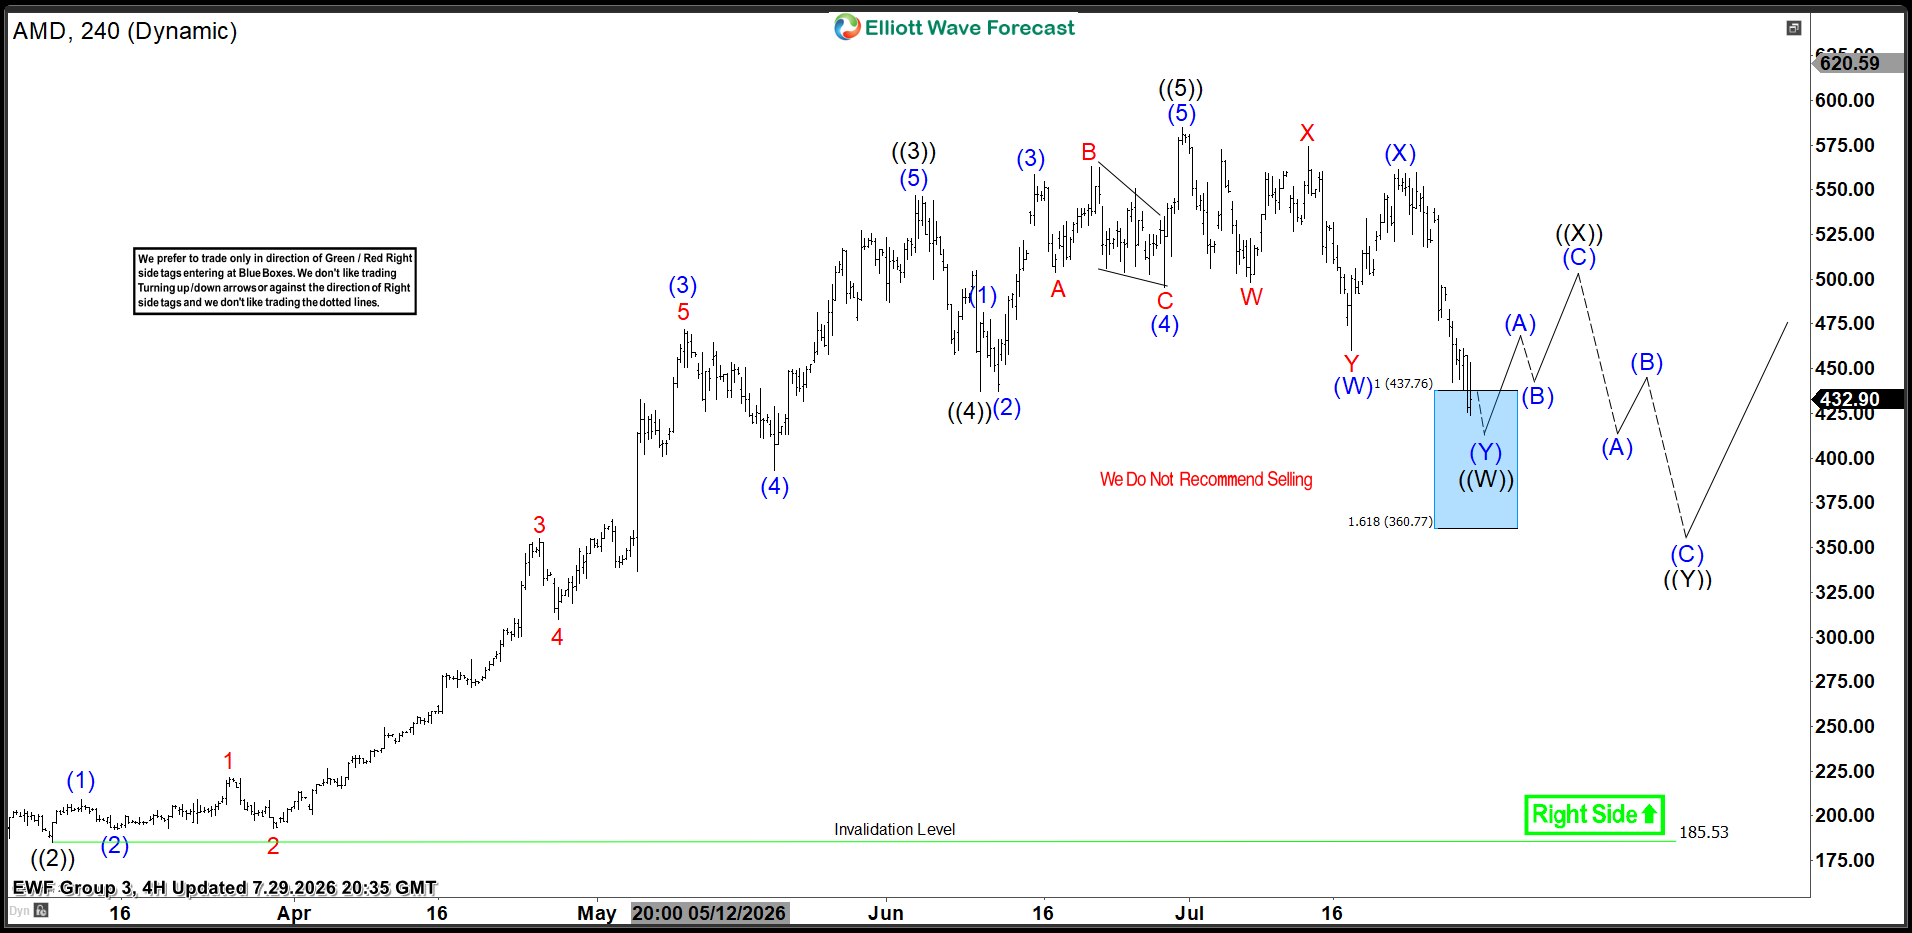
AMD Elliott Wave 1 Hour Chart 07.29.2026
AMD stock is correcting the cycle from the 185.53 low. The price has reached an important technical zone between 437.76 and 360.77, marked as the Blue Box. As our members know, this buying zone is derived by measuring the Equal Legs area using the Fibonacci Extension tool. From this area, we expect buyers to step in and regain control, potentially driving the price higher in a three-wave bounce. Once the bounce reaches the 50% Fibonacci retracement against the (X) connector high, we will take partial profits and move the stop loss to break-even.
You can learn more about Elliott Wave Patterns at our Free Elliott Wave Educational Web Page
90% of traders fail because they don’t understand market patterns. Are you in the top 10%? Test yourself with this advanced Elliott Wave Test
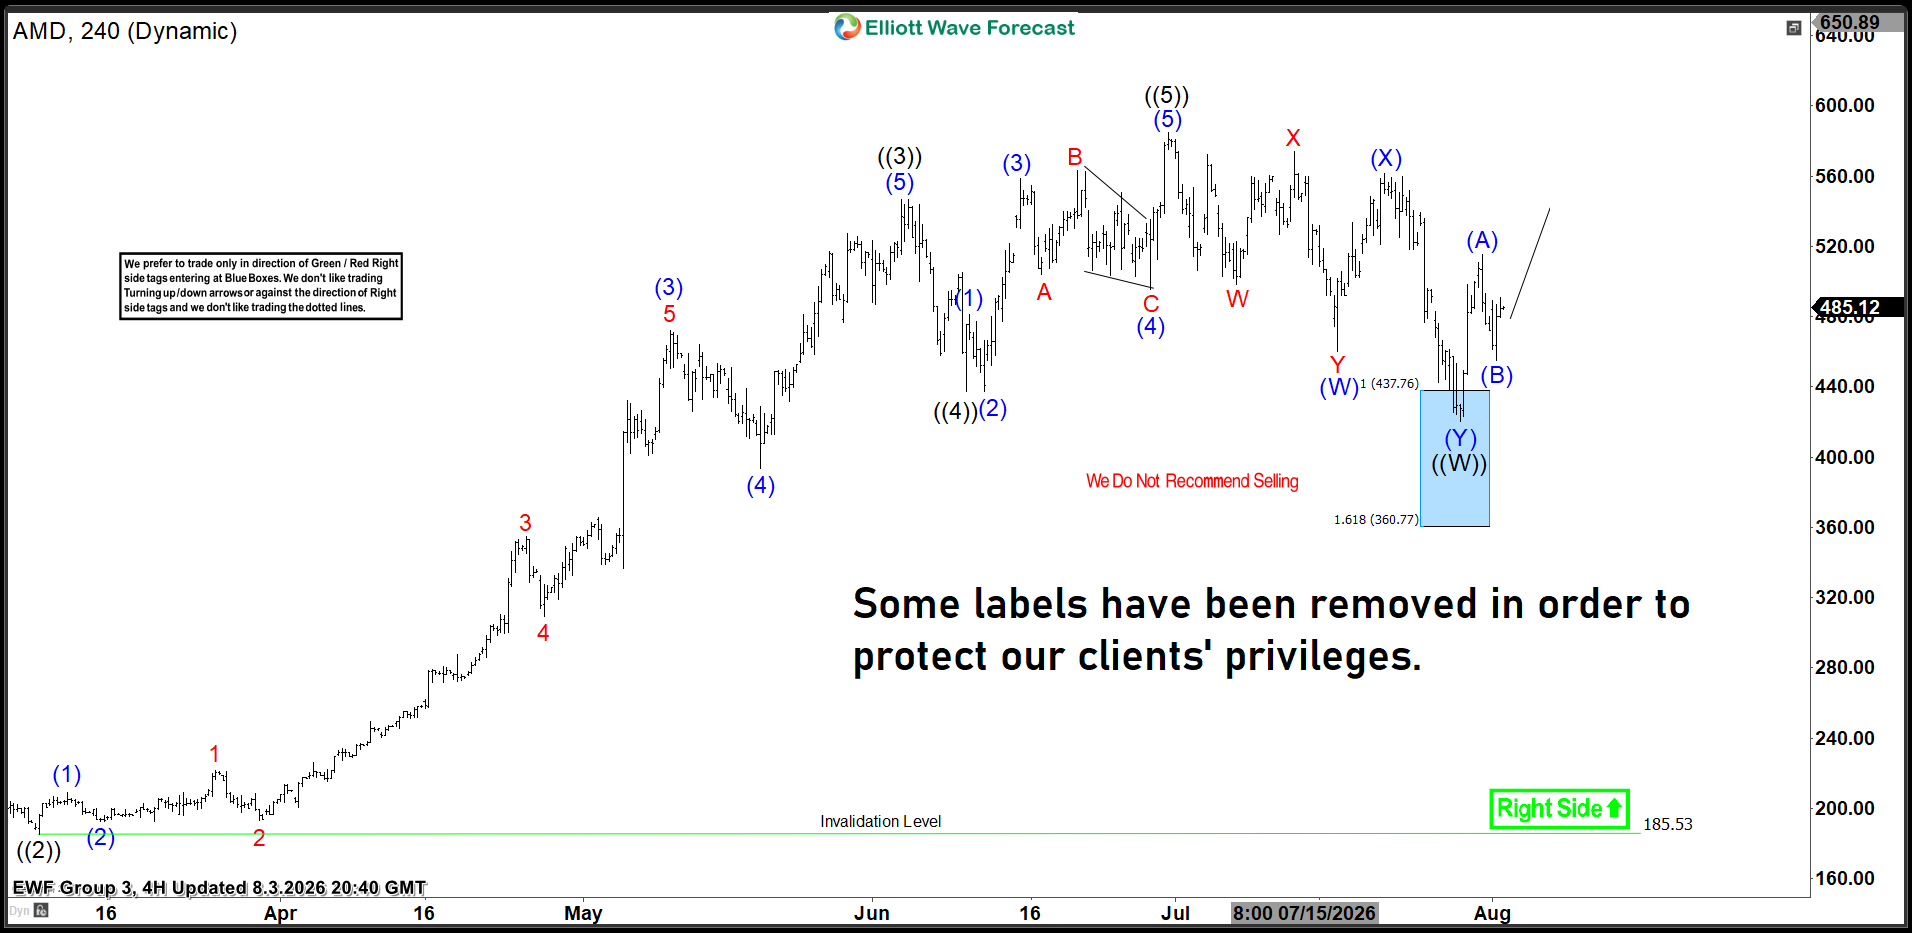
AMD Elliott Wave 1 Hour Chart 08.03.2026
The stock found buyers at the Equal Legs zone, producing a solid reaction from that area. As a result, long positions taken from the Equal Legs zone are now risk-free. The rally from the buying zone looks impulsive, so we assume we should see at least another leg higher in five waves.
Important note: Our analysis is not based on Elliott Wave in isolation. We perform detailed higher-time-frame cycle analysis, which shows an incomplete market structure. This is one of the key drivers of price action, along with correlation analysis and broader market context.
We also teach our members in live analysis sessions how to identify incomplete bullish and bearish sequences. Even a 14-day trial, is enough to noticeably improve your trading analysis and forecasting approach.
Source: https://elliottwave-forecast.com/stock-market/amd-finds-support-in-the-blue-box-buyers-zone/