
TXN advanced above $230 to a reach a fresh record high. How further upside could it go in the near-term? Currently, a pullback has emerged against the long-term bullish cycle. Where should traders position to buy again?
Texas Instruments (TXN) is a global semiconductor company known for designing and manufacturing analog and embedded processing chips. Its products are used in everything from industrial equipment to personal electronics, playing a critical role in powering modern technology. Consistent innovation and a strong market presence make it a closely watched stock in the tech sector.
TXN finished its extended grand supercycle wave ((II)) in October 2002, reaching a low around $13. Following that, the stock initiated a significant advance spanning two decades as grand supercycle wave ((III)) progressed. Wave (I) of ((III)) reached its highest point in August 2007 at $39.6, followed by a substantial wave (II) correction that pushed prices down to approximately $13.4 by December 2008.
The subsequent major uptrend—wave (III)—started in December 2008. TXN demonstrated a strong bullish trend after exceeding its previous all-time high from March 2000 at $99.8, eventually hitting a new high of $202.2 in October 2021. This peak concluded wave III of (III) of ((III)). A corrective wave IV followed, continuing until October 2023, after which the stock continued its upward movement and recorded a new high of $220.38 in November 2024.
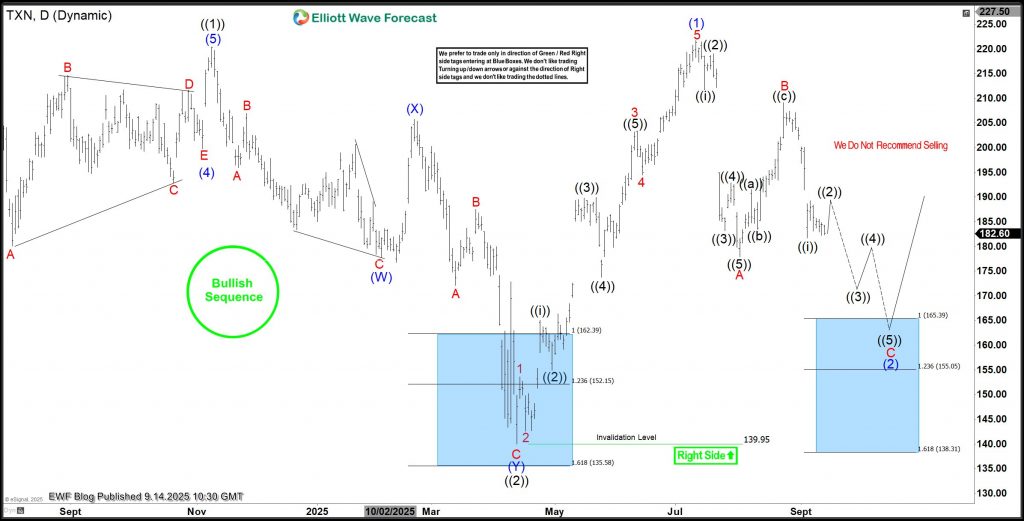
Starting from the November 2024 peak, TXN retraced in a 7-swing pattern to complete wave ((2)) of V. That correction ended at the blue-box support level, where, as expected, buyers re-entered the market. The stock then strongly rebounded in a clear 5-wave advance, finishing wave (1) of ((3)) on July 11, 2025. On September 14, we presented the daily chart below, highlighting the blue box where traders should look to re-enter.
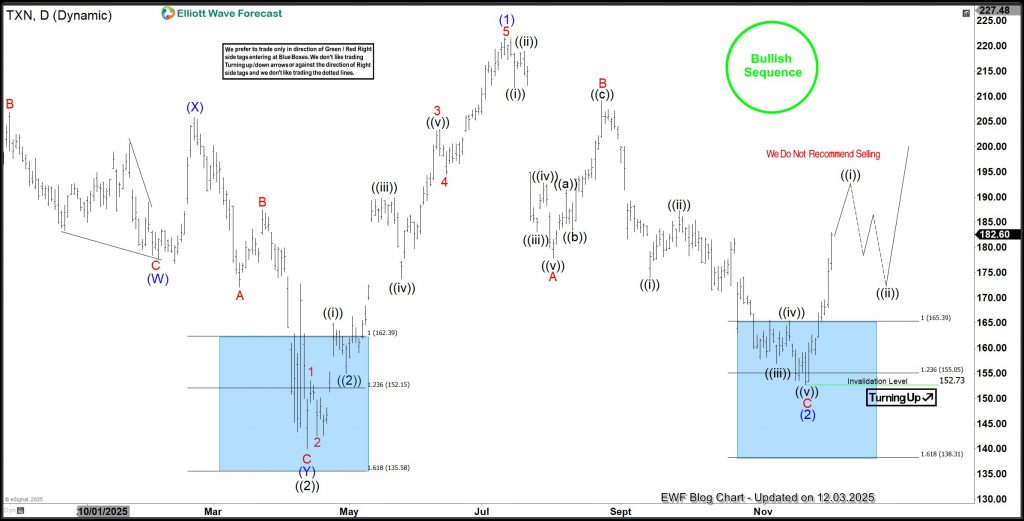
In our last update, the chart below showed a swift reaction from the blue box, confirming the end of wave (2) of ((3)).
We anticipated a sustained rally in a new bullish cycle for wave (3) of ((3)), breaking into a new record high. After just 10 weeks, the bulls remained strong, and the stock achieved a new record high, as expected. The chart below shows the latest TXN daily chart.
TXN Elliott Wave Analysis (Daily Chart) – 25th February, 2025
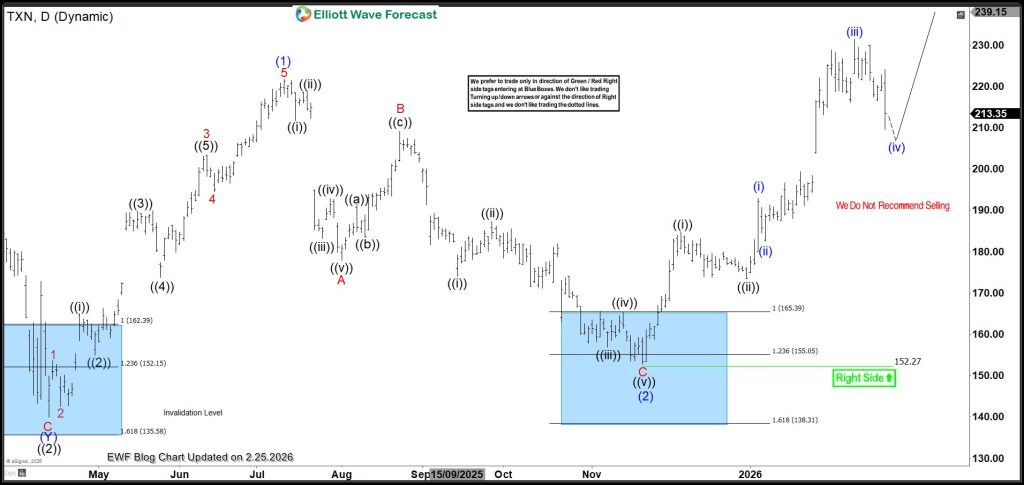
As the latest daily chart above shows, the stock has breached a new record high as wave (3) develops from the November 2025 low. Currently, the price is precisely at wave (iv) of ((iii)) of 1 of (3). Therefore, wave (3) still has considerable room to run, presenting prospective trading opportunities for Elliott Wave traders. The strategy is straightforward: buy the dips. Additionally, a pullback has emerged in a shorter cycle. The H4 chart below indicates the blue box zone where wave (iv) could complete, paving the way for the next short-term bullish move as part of a larger bullish trend.
TXN Elliott Wave Analysis (4/Hour Chart) – 25th February, 2025
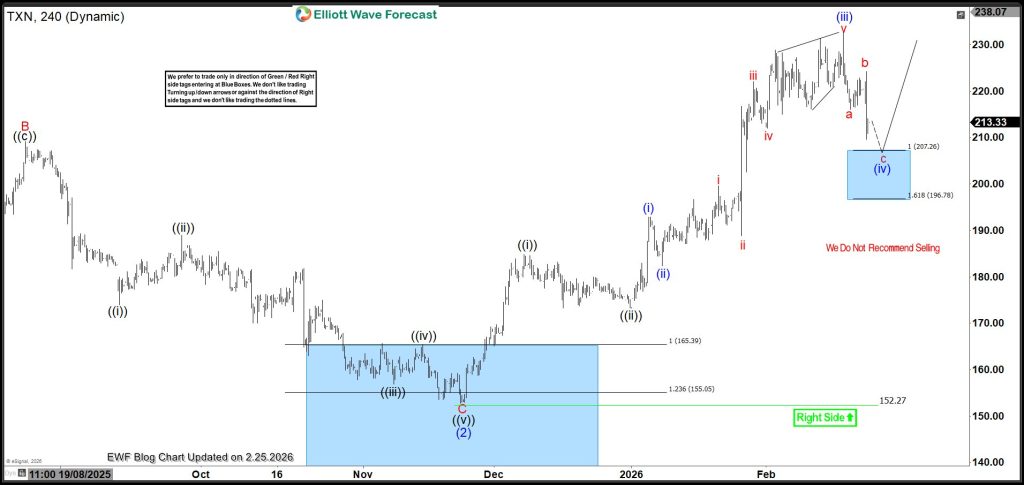
The chart above shows the emerging wave (iv) with a blue box zone between 207.26 and 196.78. Buyers could establish new positions here, anticipating at least a 3-swing bounce. As this is the 4th wave in a strong bullish cycle, the pullback is not expected to be significant, making this another potential profitable trade. You can get similar analysis and blue boxes across all time frames on the 78 instruments we currently cover.
Source: https://elliottwave-forecast.com/stock-market/txn-pullback-shortterm-bluebox/