Pan American Silver Corp. (PAAS) is one of the world’s largest primary silver producers, with diversified mining operations across the Americas. In addition to silver, the company has substantial exposure to gold and other precious metals. This makes it a key player in the resource sector. In this article, we will update the long term Elliott Wave technical outlook of the stock.
PAAS Monthly Elliott Wave Chart
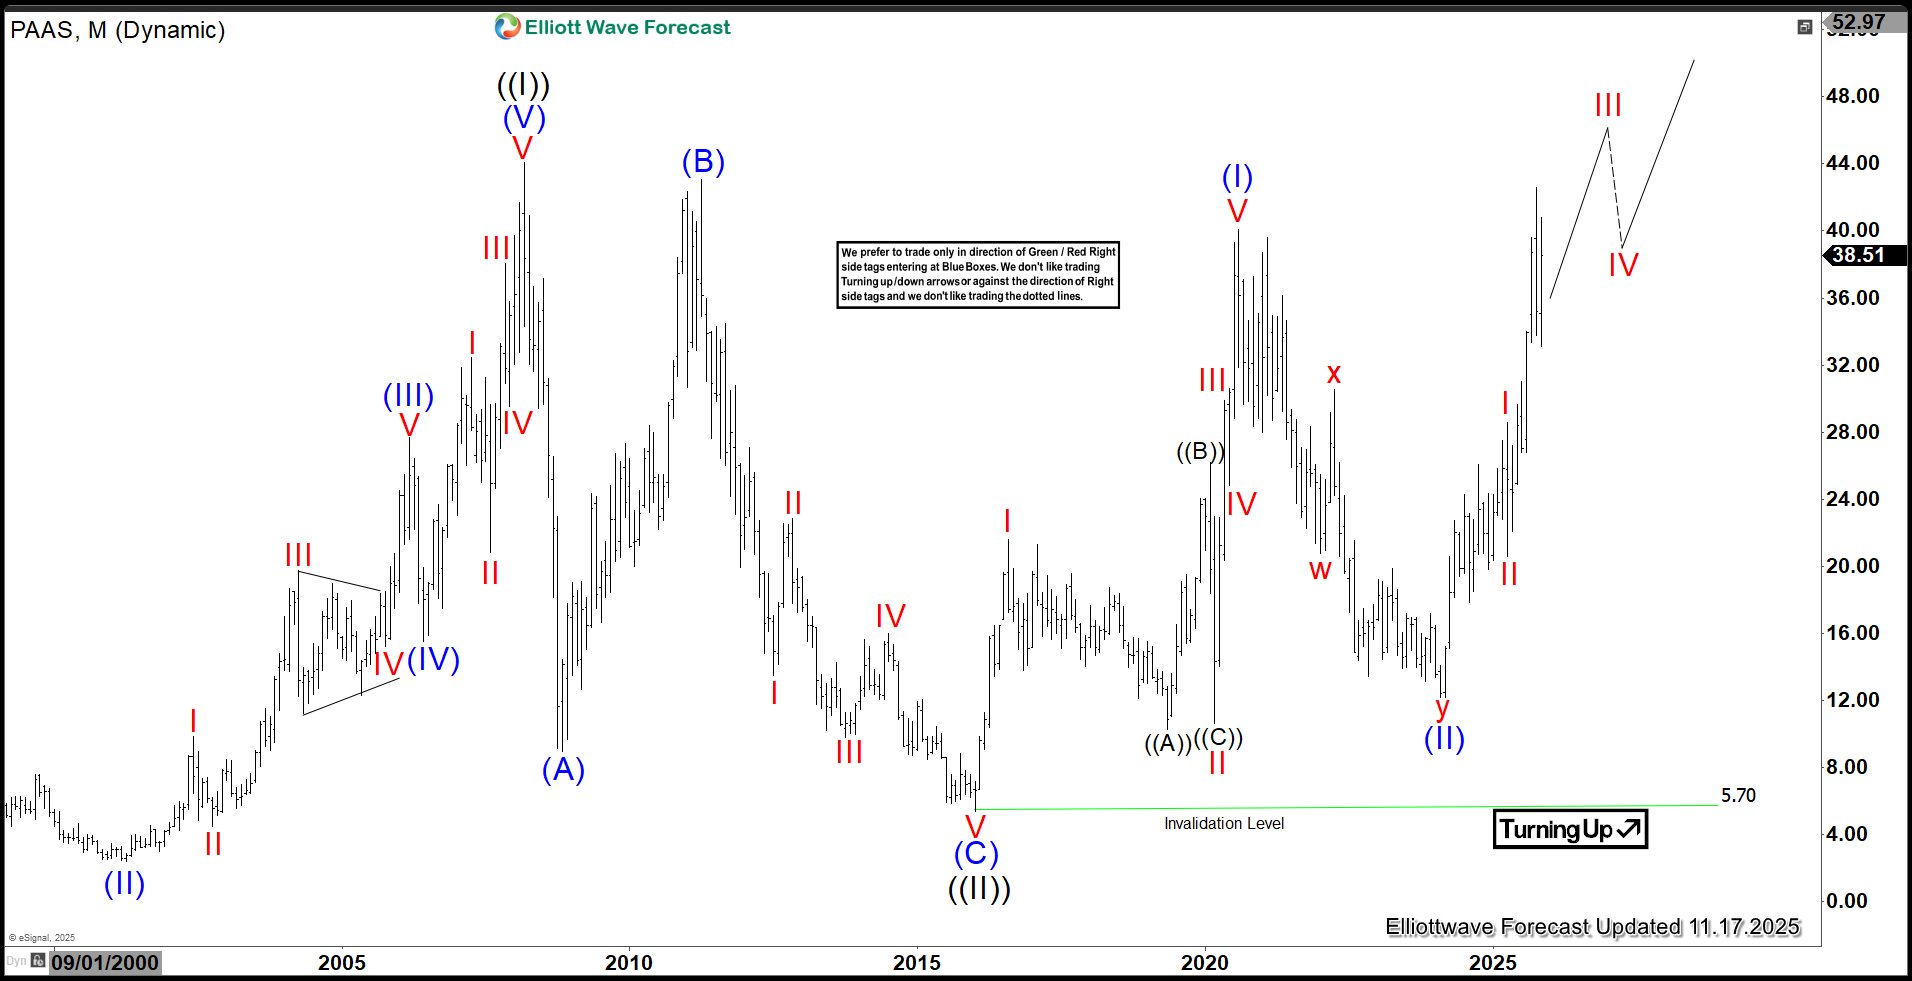
The monthly Elliott Wave analysis for Pan American Silver (PAAS) suggests that the stock completed wave ((II)) of the Grand Supercycle at the $5.89 low, establishing a major long-term pivot. Since then, it has embarked on wave ((III)), which is unfolding as a bullish impulse. From that base, wave (I) advanced to $40.11 before undergoing a corrective wave (II) that bottomed at $12.16. The rally resumed in wave (III), within which wave I peaked at $28.60 and wave II retraced to $20.55. Provided the $5.89 low remains intact, corrective pullbacks are expected to attract buyers in a 3-, 7-, or 11-swing structure, reinforcing the bullish trajectory and supporting further upside potential.
PAAS Daily Elliott Wave Chart
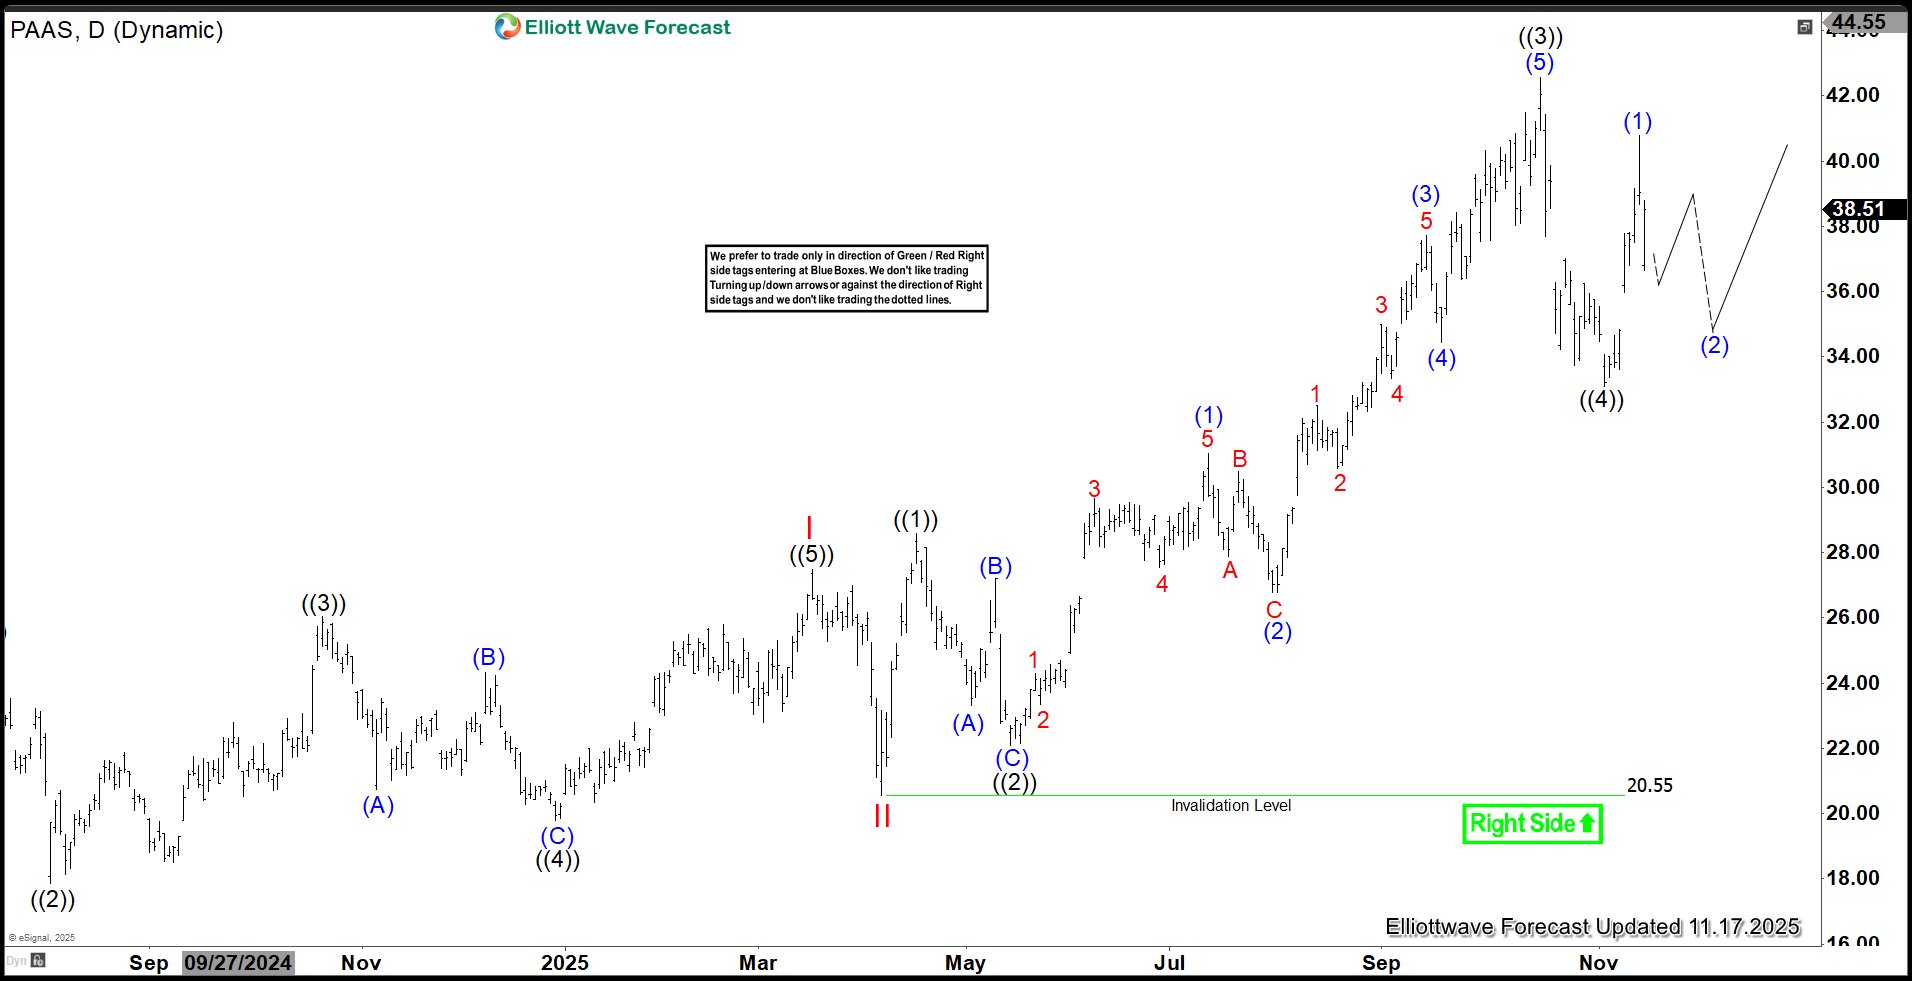
The daily Elliott Wave analysis for Pan American Silver (PAAS) suggests that the rally from the February 13, 2024 low completed wave I at $27.47, followed by a wave II correction that bottomed at $20.55. The stock has since resumed its upward trajectory in wave III, which is unfolding as an impulsive structure. From the wave II low, wave ((1)) advanced to $28.60, then corrected in wave ((2)) to $22.08. The subsequent rally carried the stock to $42.57, marking the completion of wave ((3)). A pullback in wave ((4)) appears to have found support at $33.08, proposing it as a completed low. As long as this level holds, PAAS is expected to extend higher in wave ((5)), with a projected target zone between $44.80 and $48.41—representing the 123.6% to 161.8% external retracement of wave ((4)).
Source: https://elliottwave-forecast.com/stock-market/elliott-wave-paas-resume-higher-wave-5-targeting-44-8/