
Hello traders. As our members know, we’ve been favoring the long side in BTCUSD and have made profitable long setups. However, the structure recently has shown clear incomplete sequences from the peak, suggesting more downside in the near term. In this technical article, we are going to present short term Elliott Wave forecast of Bitcoin, including target areas.
BTCUSD Elliott Wave 1 Hour Chart 11.04.2025
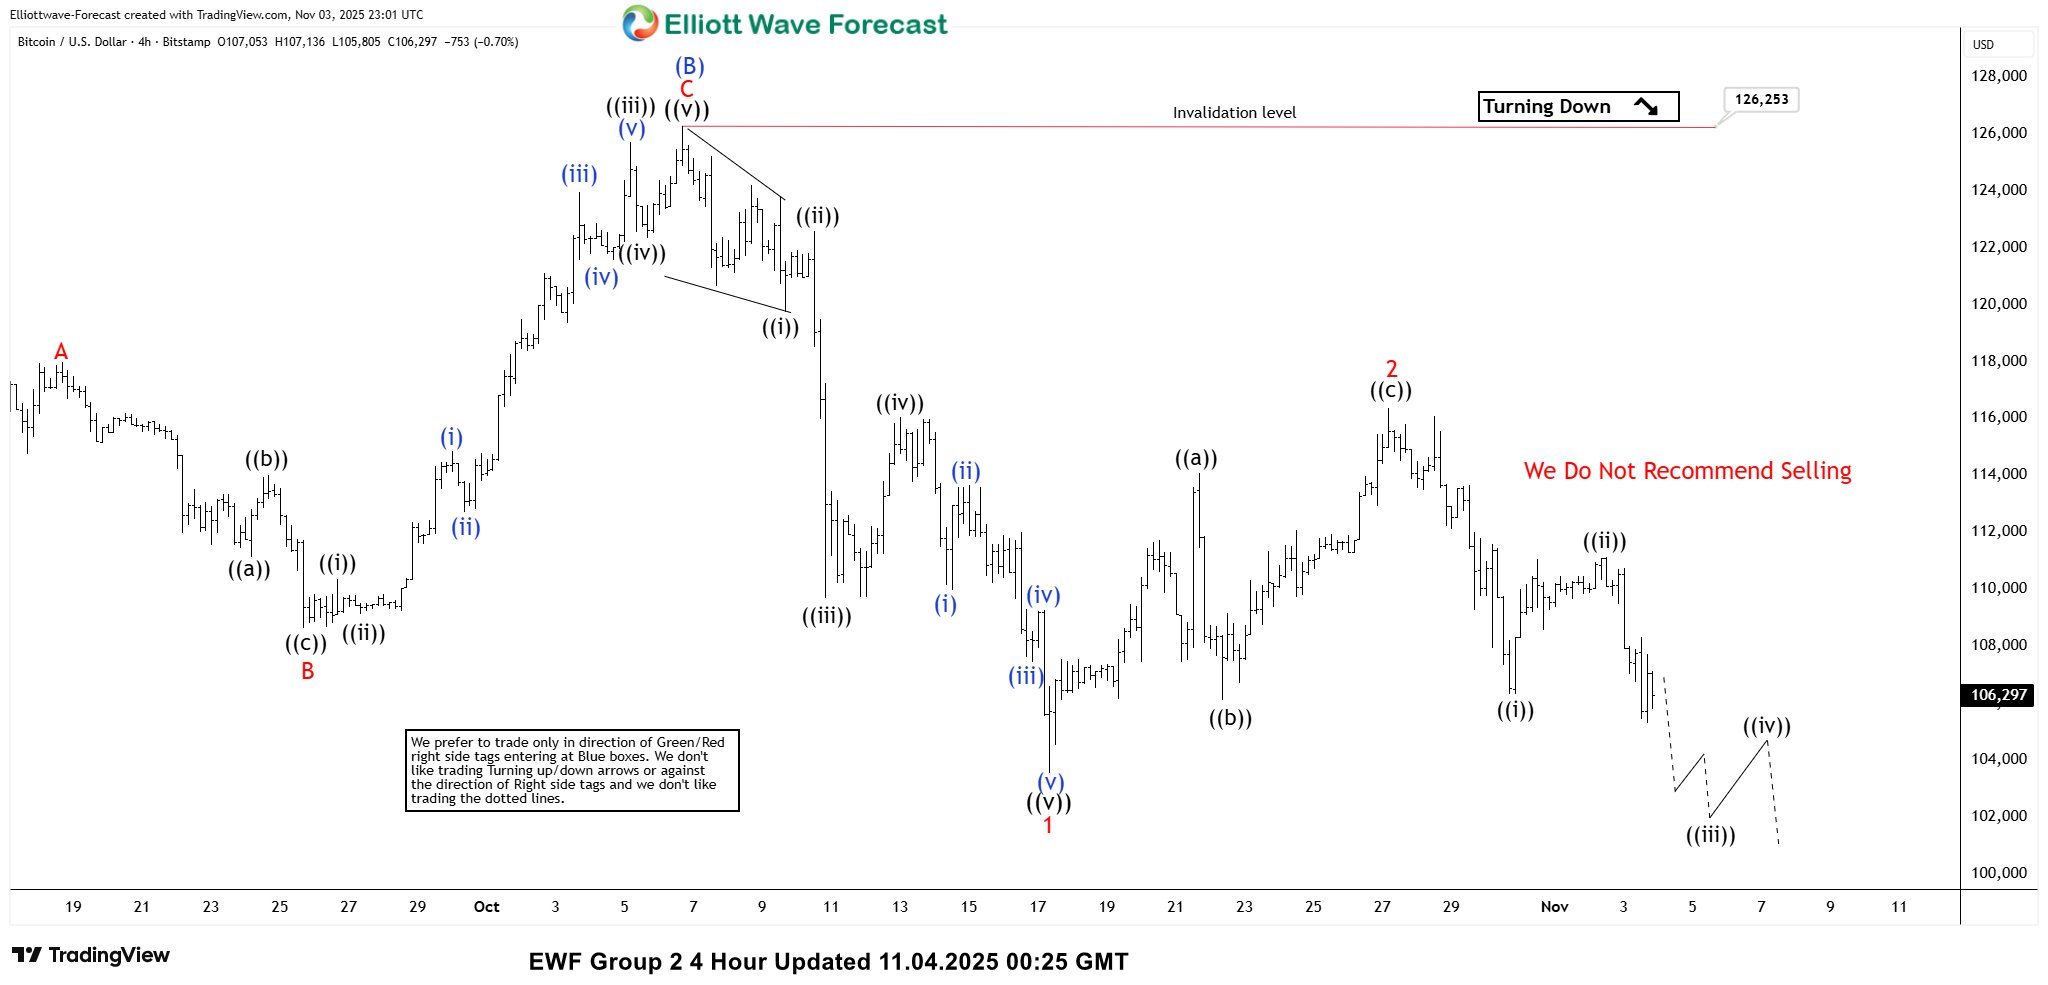
Let’s take a look at the BTCUSD Elliott Wave chart from November 4th, which we presented to members. Back then, we suggested that Bitcoin still trades within the cycle from the 126,253 all-time high. One reason for that outlook is the new short-term low in crypto, marked by a break below the 106,426 low. ( wave ((i)) black on the chart below). This break shows that the cycle from wave 2 red peak remains incomplete. We expect more downside toward the 101,520–99,243 area (first target). A break below wave 1 red would confirm this view. In that case, the cycle from the all-time high stays incomplete and could extend toward the 94,492–89,249 ( buyers zone).
90% of traders fail because they don’t understand market patterns. Are you in the top 10%? Test yourself with this advanced Elliott Wave Test
Official trading strategy on How to trade 3, 7, or 11 swing and equal leg is explained in details in Educational Video, available for members viewing inside the membership area.
Source: https://elliottwave-forecast.com/trading/bitcoin-btcusd-elliott-wave-4-2/