
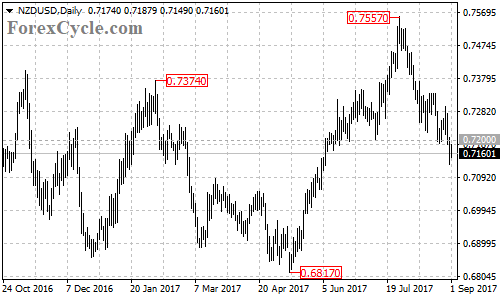
NZDUSD recently broke below a major support level at 0.7200, indicating that the uptrend from 0.6817 had completed at 0.7557 already. The pair is now in downtrend, further decline would likely be seen after correction.
On the downside
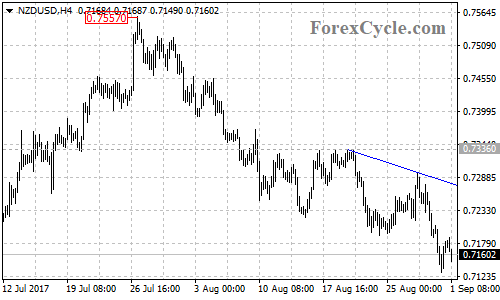
There is a bearish trend line on the 4-hour chart with resistance now at around 0.7280. As long as the price is below the trend line, the downside movement from 0.7557 could be expected to continue and next target would be at the 61.8% Fibonacci retracement taken from 0.6817 to 0.7557 at 0.7100, followed by the 76.4% retracement at 0.6990.
On the upside
A break of the support-turned-resistance level at 0.7200 could bring price back to test the resistance of the bearish trend line on the 4-hour chart. A clear break above the trend line resistance will suggest that correction for the downtrend from 0.7557 is underway, then the following upside movement could take price to next resistance level at 0.7336, followed by 0.7400.
For long term analysis
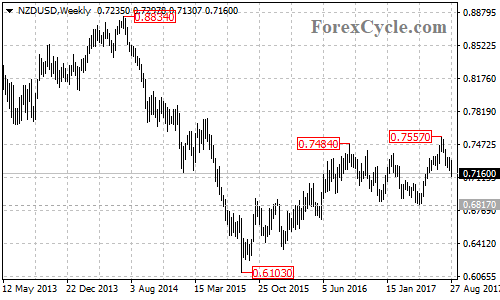
The NZDUSD pair might be forming a double top pattern with neckline at 0.6817 level on its weekly chart. A clear break below 0.6817 support level will confirm the double top pattern, then the measured move target would be at around 0.6100 area.
Technical levels
Support levels: 0.7100 (the 61.8% Fibonacci retracement), 0.6990 (the 76.4% Fibonacci retracement), 0.6817 (the May 11 low, the neckline of the double top pattern on the weekly chart).
Resistance levels: 0.7200 (the July 11 low, support-turned-resistance), 0.7280 (the bearish trend line on the 4-hour chart), 0.7336 (the August 21 high), 0.7400.