
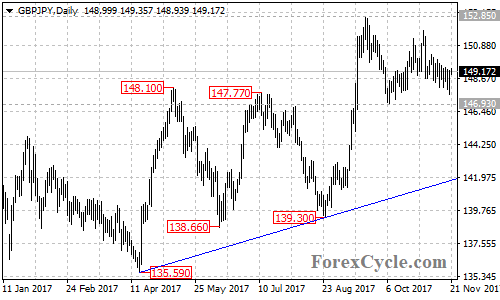
GBPJPY moved sideways in a trading range between 146.93 and 152.85 for several weeks. Support is at 146.93, as long as this level holds, the sideways movement in the range could be treated as consolidation of the uptrend from 139.30 and another rise towards 164.00 is possible after the consolidation.
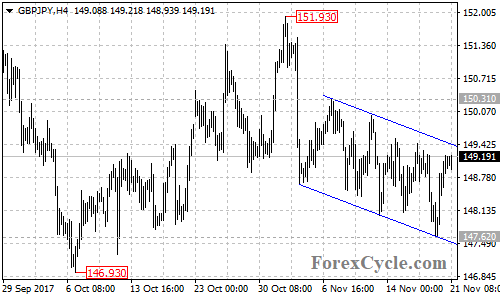
There is a falling price channel with resistance at at around 149.45 on the 4-hour chart. The GBPJPY pair is now facing the top trend line of the channel. Breakthrough the channel resistance could take price to next resistance level at 150.31. Above here would aim 151.93, followed by 152.85.
A breakout of 152.85 resistance will confirm that the uptrend from 122.36 has resumed, then next target would be at 156.50. Above here could trigger further upside movement towards 164.00. This would be the final target for the upside movement.
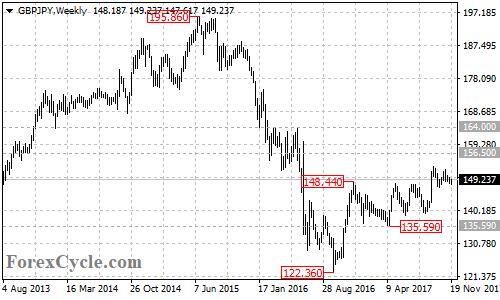
On the other side, as long as the price is in the price channel on the 4-hour chart, the downside movement from 151.93 could be expected to continue and another fall to test 146.93 support is still possible. A breakdown below this level will indicate that lengthier consolidation for the uptrend from 122.36 is underway, then the pair would find support at the bullish trend line on the daily chart now at around 141.80, followed by 139.30. The key support is at 135.59, only a breakdown below this level could signal completion of the uptrend.
Technical levels
Support levels: 146.93, 141.80, 139.30, 135.59, 122.36.
Resistance levels: 149.45, 150.31, 151.93, 152.85, 156.50, 164.00.