
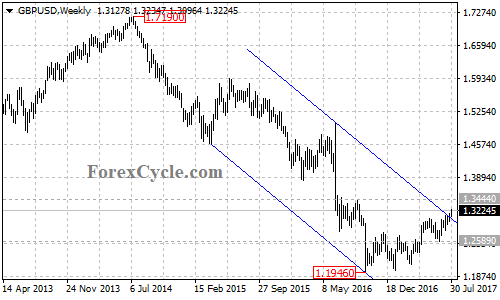
GBPUSD broke above the descending price channel at 1.3100 on its weekly chart, indicating that lengthier correction for the long term downtrend from the July 2014 high of 1.7190 is needed.
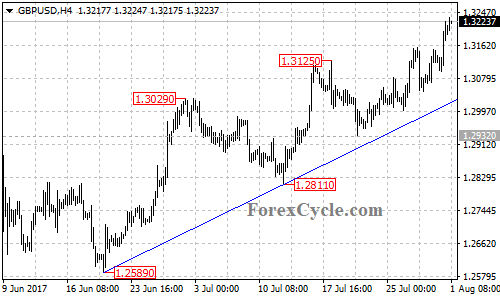
On the 4-hour chart, the GBPUSD pair stays above the bullish trend line from 1.2589 to 1.2811, with support at around 1.3015. As long as the trend line support holds, the upside movement could be expected to continue and next target would be at 1.3444, followed by 1.3700.
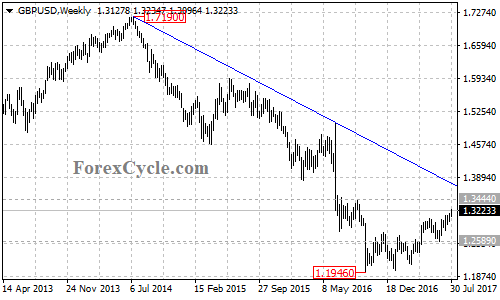
However, the price action from the October 2016 low of 1.1946 would possibly be correction of the long term downtrend. There is another long term bearish trend line on the weekly chart, with resistance now at around 1.3700. This would be the final target for the correction rebound. Reversal could be expected after touching this trend line resistance.
On the downside, a clear break below the trend line on the 4-hour chart could bring price back to next support level at 1.2932, followed by 1.2811. The 1.2811 level could be treated as the key support for the upside movement from the January 16 low of 1.1987, below this level could signal completion of the uptrend, then the following downside movement could bring price to retest 1.1946 support.
Technical levels
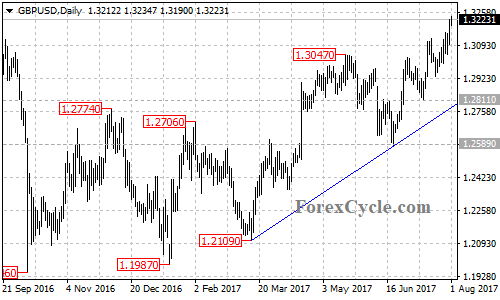
Support levels: 1.3015 (the bullish trend line on the 4-hour chart), 1.2932 (the July 20 low), 1.2811 (the key support), 1.2589 (the June 21 low), 1.2109 (the March 14 low), 1.1946 (the October 2016 low).
Resistance levels: 1.3444 (the September 2016 high), 1.3700 (the trend line on the weekly chart).