
The USDCAD pair recently broke below the channel support and 1.2968 key support on its weekly chart, indicating that the long term bearish movement from the January 2016 high of 1.4689 has resumed. The pair extended its bearish movement to as low as 1.2627, facing an important support level at the May 2016 low of 1.2460.
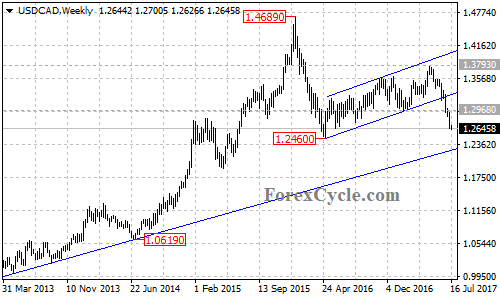
On its daily chart, the pair stays below a bearish trend line with resistance at 1.2940. As long as the price is below the trend line, the downtrend from 1.3793 could be expected to continue and further decline towards 1.2460 support is possible in the coming days. A breakdown below this level could take price to the ascending trend line on the weekly chart, from the September 2012 low of 0.9632 to the July 2014 low of 1.0619 now at 1.2260. If the pair moves below the trend line support, next target would be at the 50% retracement, taken from the July 2011 low of 0.9406 to 1.4689 at around 1.2050.
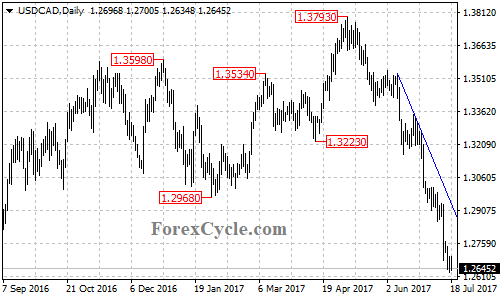
Near term resistance is at 1.2800, above this level could take price to test the trend line resistance on the daily chart. A clear break above the trend line resistance will indicate that correction of the downtrend is underway, then the pair will find resistance at around 1.3150.
Technical levels
Support levels: 1.2460 (the May 2016 low), 1.2260 (the ascending trend line on the weekly chart), 1.2050 (the 50% retracement).
Resistance levels: 1.2800 (near term resistance), 1.2940 (the bearish trend line on the daily chart), 1.3150.