
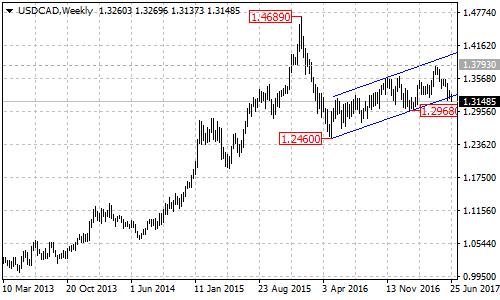
USDCAD’s fall from the May 5 high of 1.3793 extended to as low as 1.3137 and broke below the bottom support trend line at 1.3230 of the price channel on its weekly chart, suggesting that the uptrend from the May 2016 low of 1.2460 had completed at 1.3793 already.
On the downside
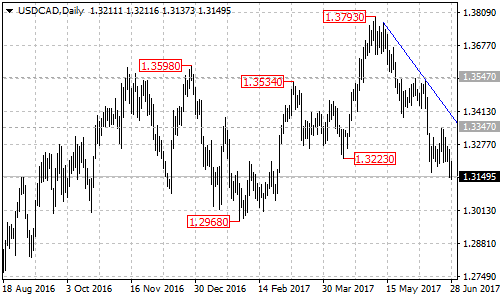
The USDCAD pair stays below a bearish trend line with resistance is at around 1.3390 on its daily chart. The June 21 high of 1.3347 also acts as a near term resistance for the downtrend. As long as the pair is below these levels, the bearish movement could be expected to continue and further decline to test the import support level at 1.2968 is possible in the coming days. A breakdown below this level will confirm that the long term downtrend from the January 2016 high of 1.4689 has resumed, then the following downside movement could take price into 1.1500 zone.
On the upside
Key resistance is at 1.3400, above this level will indicate that the break of the price channel on the weekly chart is a false breakout. This could trigger another bullish movement towards the top trend line of the price channel at around 1.4000.
Technical levels
Support levels: 1.2968 (the January 31 low), 1.2460 (the May 2016 low).
Resistance levels: 1.3347 (the June 21 high), 1.3390 (the bearish trend line on daily chart), 1.3400 (the key resistance), 1.3547 (the June 2 high), 1.3793 (the May 5 high).