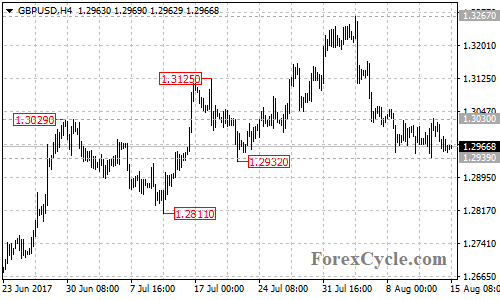
GBPUSD moved sideways in a narrow range between 1.2939 and 1.3030. As long as 1.3030 resistance holds, the sideways movement could be treated as consolidation of the downtrend from 1.3267, and further decline towards the bullish support trend line on the daily chart is possible after the consolidation. On the upside, a break of 1.3030 resistance will indicate that the downtrend had completed at 1.2939 already, then the correction rebound could bring price back into 1.3120 zone.