
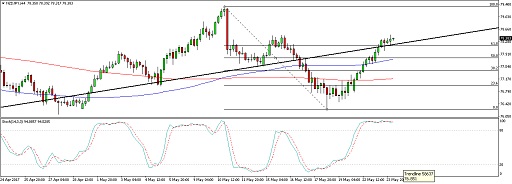
NZDJPY recently broke below a short-term rising trend line support and dipped close to the 76.00 mark. Price pulled up from there and looks ready to retest the broken support.
Applying the Fib tool on the latest swing high and low on the 1-hour chart shows that the 61.8% level lines up with the broken trend line, which might now hold as resistance. If so, NZDJPY could make its way back down to the swing low.
The 100 SMA is above the longer-term 200 SMA, though, so the path of least resistance is to the upside. However, stochastic has been indicating overbought conditions for quite some time and turning lower could draw more sellers to the game.
The Kiwi has been one of the more resilient currencies lately, holding up well against the yen and dollar even when risk aversion picks up. After all, economic data from New Zealand has been mostly upbeat in the past couple of weeks, underscoring the RBNZ’s inclination to refrain from cutting rates in the near future.
However, the yen could draw more support if geopolitical uncertainties persist and risk aversion extends its stay in the financial markets. Apart from that, changes in dollar demand owing to Fed rate hike expectations could also push the yen around.
By Kate Curtis from Trader’s Way