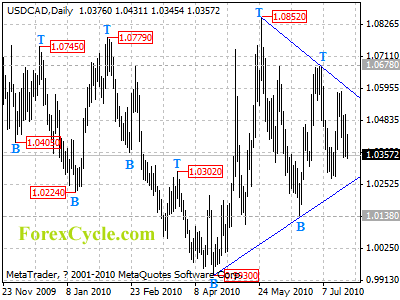
USDCAD is forming a triangle pattern on daily chart. Sideways movement in the pattern is expected next weeks. Resistance is at the upper boundary of the pattern, now at 1.0600, a clear break above this level will indicate that uptrend from 0.9930 has resumed, then rise to 1.1500 could be seen. Support is located at the lower boundary of the pattern, now at 1.0260, a clear break below this level could bring price towards 1.0000 area.
For long term analysis, USDCAD formed a cycle top at 1.0852 level on weekly chart. Rang trading between 0.9930 and 1.0852 would more likely be seen in next several weeks.