Price action traders feel that everything that is needed to analyze markets is available directly from the price chart, including a mechanism with which to enter into strong moves AS they begin.
What is this mechanism?
The mechanism is simply price itself.
After our last article investigating swing-highs and swing-lows, we can now look for areas of support and resistance as substantiated by the market.
For instance, on the chart below, notice the up-trend in the AUD/USD currency pair as price approaches the vaulted ‘parity,’ value.

(Created with Trading Station 2.0/Marketscope)
As a side-note, parity is often considered a form of ‘psychological,’ resistance as it is an even, whole number. When placing orders, as matter of natural human behavior, many traders will look to round numbers for setting of stops or limits.
This can greatly alter price action, as up-trends can be slowed by the selling that ensues with a litany of stops hit at a pre-determined price. We will investigate psychological support and resistance in a future price action piece, but for now, let’s just consider that this could be a form of resistance.
As price crosses this ‘psychological,’ level of parity, notice the sell-off that ensues. This can be predicated by limit orders that traders have placed on long positions. Once this 1.00 even level has been hit, an onslaught of sell orders come as those limits execute.
On the other end of the trade, we have short-sellers that have placed stops at that nice, round, even value of 1.0000. Once price hits parity, those stops get triggered, further exacerbating the selling that is taking place.
This brings on an entire change in momentum; as you can notice the trend-line that had supported the pairs’ bullishness on the run-up gets broken; and then price action heads lower.
The astute trader could take a step back and imagine:
The pair previously had a lot of bullishness (which is why price had run up to parity in the first place). The turn-around at 1.0000 even may have been brought on from protective stop or limit orders. If price moves up to that level again (with strength) it may break this resistance and just continue running.
This is the breakout trade. Taking these major levels of support and/or resistance and opening positions with the prevailing momentum at the time.
But what if support or resistance is far away from any psychological levels?
That’s ok, we can grade support and resistance in a variety of ways; not just with psychological levels.
For instance, in the below chart, we’ve taken a snapshot of the AUD/USD currency pair. As price runs up to .9876, we seem to hit an area of resistance. This can be identified by the fact that price wicks up to .9876 and is met by selling.
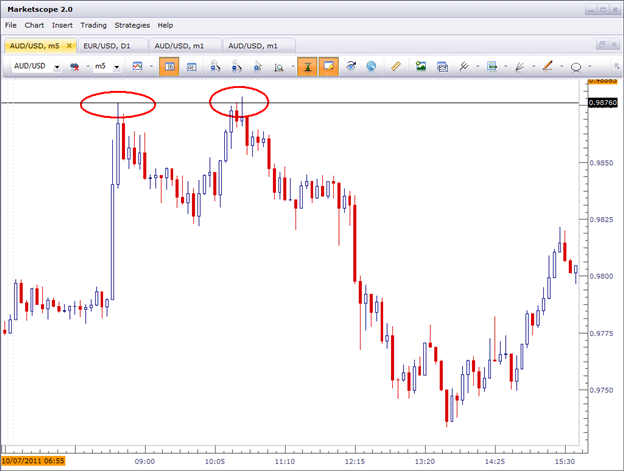
(Created with Trading Station 2.0/Marketscope)
Price then ‘re-tests,’ this .9876 level again, this time to be met with massive selling as you can see price going down by over 100 pips shortly thereafter. This should look similar to the previous chart, when price was rejected around the psychological level of parity (1.0000).
Many traders will consider the 2 points of resistance as a ‘double-top,’ candle formation. This is another tool that can be used by price action traders that we will investigate in a future piece, but for now, lets examine this level as points of resistance.
Notice, the second inflection off of .9876 wasn’t EXACTLY at .9876. This is, often-times, how price action support and resistance will work. As a ‘zone,’ of support and/or resistance; rarely is support or resistance an exactly perfect price.
The astute trader could have recognized this occurrence, and the fact that Aussie seemed to be resisting the .9876 resistance zone; and hypothesized that once AUD/USD finally broke through .9876, it may have some room to run to the upside.
Below is the same chart we were looking at previously, only this time we’re looking at what happened after the .9876 resistance zone was broken.
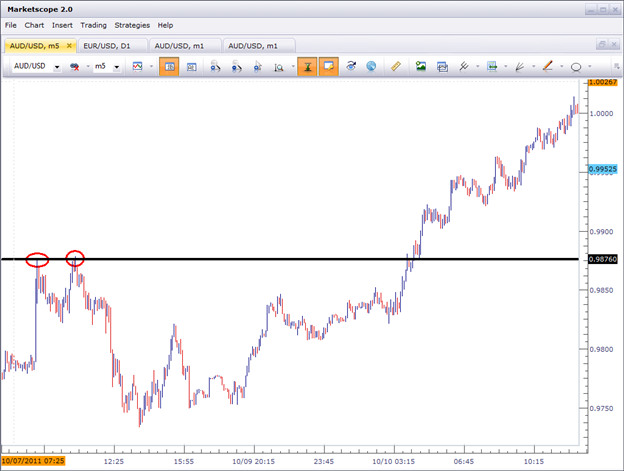
(Created with Trading Station 2.0/Marketscope)
As you may notice, the bullish strength that invigorated the AUD/USD currency pair enough to break the .9876 resistance zone continued for over 125 pips.
This is the breakout, and there is more than one way to do it.
The important thing is to identify support or resistance that we feel strongly about, and then using effective mannerisms to enter into those situations.
Written by Dailyfx.com
![]()