
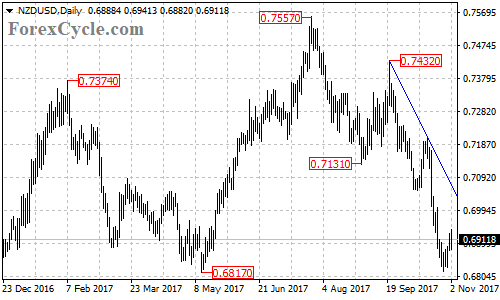
The NZDUSD pair failed in its attempt to break below 0.6817 support and bounced off to 0.6940 area, suggesting that consolidation for the downtrend from 0.7557 is needed. Further rally would likely be seen in the coming days and next target would be at 0.7000 area.
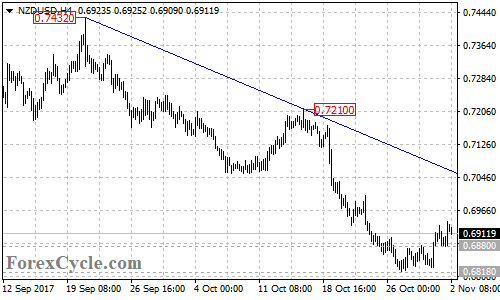
There is a bearish trend line from 0.7432 to 0.7210 with resistance at around 0.7060 on the 4-hour chart. As long as the price is below the trend line, the rise from 0.6818 could be treated as consolidation of the downtrend from 0.7432 and another fall to test 0.6817 support is still possible after the consolidation.
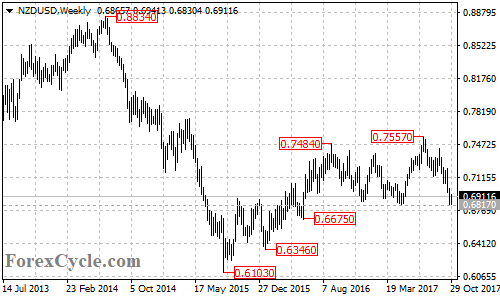
Near term support is at 0.6880, a breakdown below this level could take price to test 0.6817 key support, which acts as a neckline of the double top pattern on the weekly chart. Breakthrough here will confirm the double top pattern. This could trigger a 740 pips drop towards 0.6100.
On the other side, a breakout of the bearish trend line will suggest that the downtrend from 0.7432 had completed at 0.6818 already, then the NZDUSD pair would find next resistance level at around 0.7100, followed by 0.7210.
Technical levels
Support levels: 0.6880, 0.6817, 0.6675, 0.6346, 0.7103.
Resistance levels: 0.7000, 0.7060, 0.7100, 0.7210, 0.7432, 0.7557.