
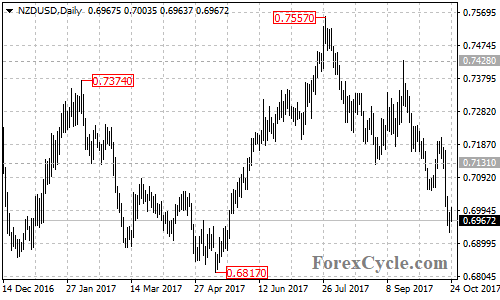
NZDUSD extended its downside movement from 0.7557 to as low as 0.6931. Further decline would likely be seen after a minor consolidation and next target would be at 0.6817.
On the 4-hour chart, the NZDUSD pair traded within a bearish price channel. The price just bounced off the bottom trend line, suggesting that consolidation of the downtrend is underway. Range trading between 0.6931 and 0.7035 is possible in the coming days.
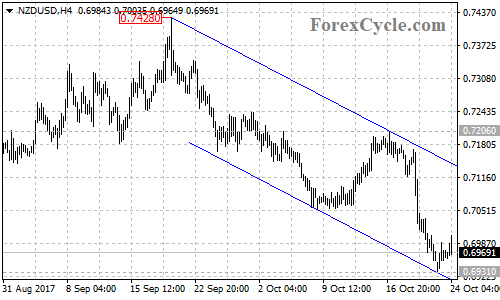
Near term resistance is at 0.7035, as long as this level holds, the downtrend could be expected to resume and a breakdown below 0.6931 support could trigger another bearish movement towards 0.6817. However, above 0.7035 resistance will indicate that lengthier consolidation for the downtrend is needed, then the pair will find resistance at the top trend line of the channel now at around 0.7140, followed by 0.7206.
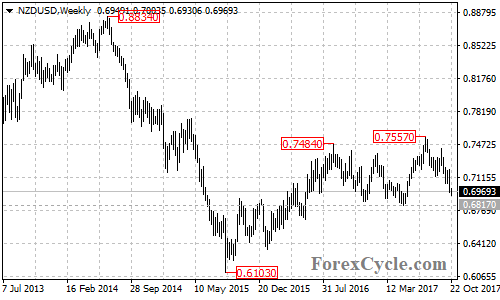
For long term analysis, the NZDUSD pair is facing an important support at 0.6817 which acts as a neckline of a double top pattern on the weekly chart. Below this level will confirm that a reversal pattern had been formed, then the measured move target would be at around 0.6100 area.
Technical levels
Support levels: 0.6931 (the October 23 low), 0.6817 (the May 11 low, the neckline of the double top pattern on the weekly chart).
Resistance levels: 0.7035 (near term resistance), 0.7140 (the top of the price channel on the 4-hour chart), 0.7206 (the October 17 high), 0.7428 (the September 20 high).