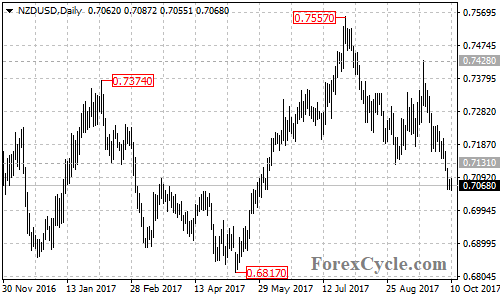
The NZDUSD pair recently broke below an important support level at 0.7131 and extended its bearish movement from 0.7557 to as low as 0.7055, indicating that the bearish movement from 0.7557 has resumed. Further decline towards 0.6817 would likely be seen over the next several weeks.
There is a bearish trend line with resistance at around 0.7130 on the 4-hour chart. As long as the price is below the trend line, the downside movement from 0.7428 could be expected to continue and next target would be at the 76.4% Fibonacci retracement taken from 0.6817 to 0.7557 at 0.6990, followed by 0.6817.
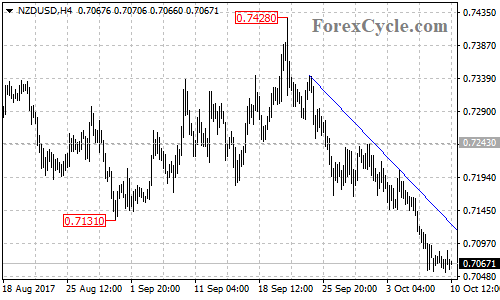
On the other side, an upside break of 0.7100 level could take price back to test the resistance of the bearish trend line. Breakthrough the trend line would suggest that the downtrend from 0.7428 is complete, then the following correction rebound could take price to next resistance level at 0.7243.
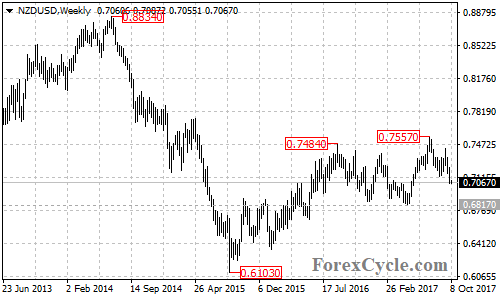
For long term analysis, the NZDUSD pair seems to be forming a double top reversal pattern with neckline at 0.6817 level on its weekly chart. Below the neck line if seen could confirm that the whole upside move from 0.6103 had completed at 0.7557 already, then the measured move target would be at around 0.6100 area.
Technical levels
Support levels: 0.6990 (the 76.4% Fibonacci retracement), 0.6817 (the May 11 low, the neckline of the double top pattern on the weekly chart).
Resistance levels: 0.7130 (the bearish trend line on the 4-hour chart), 0.7243 (the September 29 high), 0.7428 (the September 20 high).