
NZDUSD stays in a falling price channel on its 4-hour chart, suggest that the pair remains in the downtrend from 0.7428. As long as the as the price is in the channel, the downside move could be expected to continue and further decline to test 0.7131 support would likely be seen in the coming days.
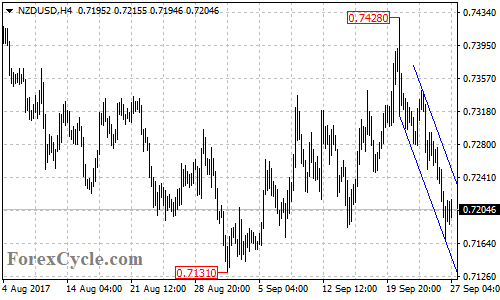
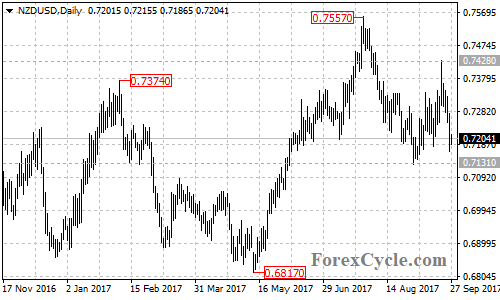
A breakdown below 0.7131 support would indicate that the longer term downtrend from 0.7557 has resumed, then next target would be at 61.8% Fibonacci retracement taken from 0.6817 to 0.7557 at 0.7100, followed by the 76.4% retracement at 0.6990.
Near term resistance is located at the top trend line of the price channel on the 4-hour chart now at around 0.7250, followed by 0.7300, only break above these levels could indicate that lengthier correction for the downtrend from 0.7557 is underway, then the following upside movement could take price back towards 0.7428.
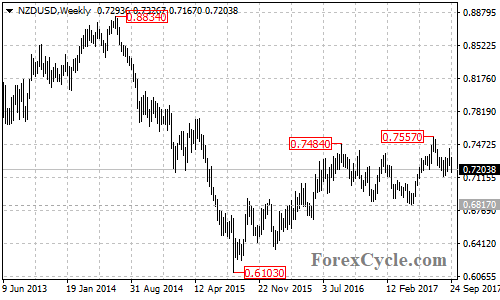
For long term analysis, the NZDUSD pair might be forming a double top reversal pattern with neckline at 0.6817 level on its weekly chart. A breakdown below the neckline support could confirm the pattern, then the measured move target would be at around 0.6100 area.
Technical levels
Support levels: 0.7131 (the August 31 low), 0.7100 (the 61.8% Fibonacci retracement), 0.6990 (the 76.4% Fibonacci retracement), 0.6817 (the May 11 low, the neckline of the double top pattern on the weekly chart).
Resistance levels: 0.7250 (the top trend line of the price channel on the 4-hour chart), 0.7300 (near term resistance), 0.7428 (the September 20 high).