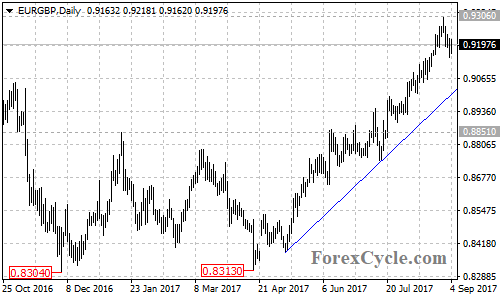
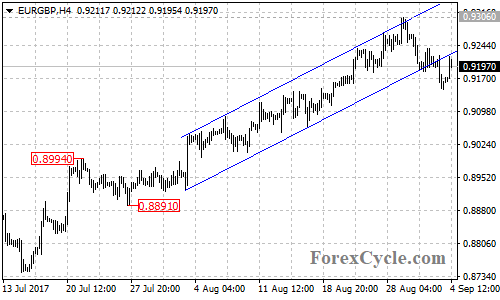
After touching the October 2016 high of 0.9305, EURGBP pulled back from 0.9306 and broke below the bottom support trend line of the price channel on its 4-hour chart, indicating that the upside movement from 0.8891 had completed at 0.9306 already. Deeper decline could be expected over the next several days, and the target would be at the bullish trend line on the daily chart now at around 0.9005.
On the upside, as long as the price is above the bullish trend line on the daily chart, the fall from 0.9306 would possibly be consolidation of the uptrend from 0.8313, and further rise towards 0.9400 is still possible after the consolidation.