
USDCHF moved sideways in a trading range between 0.9583 and 0.9772 on the 4-hour chart for several weeks. All we can do is wait for the breakout to occur.
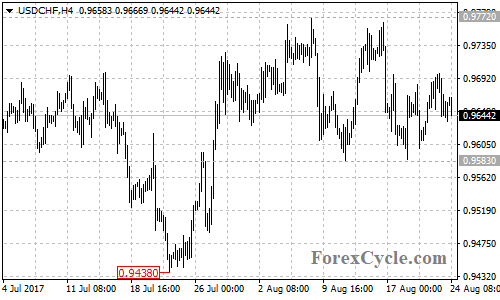
On the upside
A breakout of 0.9772 could signal resumption of the uptrend from 0.9438, then next target would be at the support-turned-resistance at the January 31 low of 0.9861, followed by the April 10 high of 1.0108.
On the downside
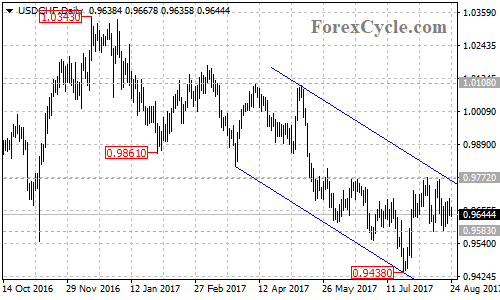
There is a bearish price channel with resistance at the its top trend line now at around 0.9761 on the daily chart. As long as the price is in the channel, the rise from 0.9438 could be treated as consolidation of the bearish movement from 1.0343 and further decline would more likely be seen after the sideways movement.
A move through 0.9583 support could take price to next support level at 0.9438. Below this level will confirm that the downtrend from 1.0343 has resumed, then the following bearish movement could bring price to 0.9200 or even 0.9072.
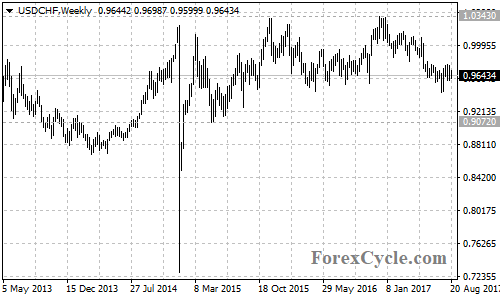
For long term analysis
The USDCHF pair is moving sideways in a trading range between 0.9072 and 1.0343, strongly rebound could be seen after touching 0.9072 support, and this would be the final target for the downside movement.
Technical levels
Support levels: 0.9583 (the August 11 low), 0.9438 (the July 21 low), 0.9200, 0.9072 (the May 2015 low).
Resistance levels: 0.9761 (the top trend line of the price channel on the daily chart), 0.9772 (the August 8 high), 0.9861 (the January 31 low), 1.0108 (the April 10 high).