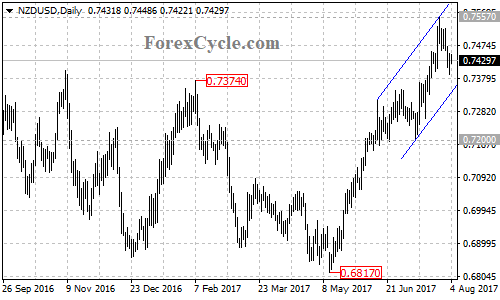
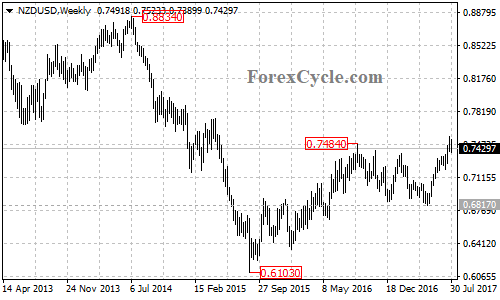
After breaking above the resistance of the September 2016 high of 0.7484 high, NZDUSD pulled back from 0.7557, suggesting that a short term top had been formed on the daily chart.

On the upside, the pair stays in a bullish price channel with support at its bottom trend line at around 0.7340 on the daily chart, and remains in uptrend from 0.6817. As long as the channel support holds, the fall from 0.7557 could be treated as consolidation of the uptrend. Further rise could be expected after the consolidation, and a break out of 0.7757 resistance could signal resumption of the uptrend, this could trigger another bullish movement towards the 61.8% Fibonacci retracement, taken from the July 2014 high of 0.8834 to the August 2015 low of 0.6103, at around 0.7790.
On the downside, a clear break below the bottom trend line of the channel could take price to next support level at 0.7200, below this level will confirm that the upside movement from 0.6817 had completed at 0.7557 already, then the following downside movement could bring price back to test 0.6817 support.

The 0.6817 level could be treated an important support for the long term uptrend from 0.6103, a breakdown below this level could signal completion of the whole upside movement.
Technical levels
Support levels: 0.7340 (the bottom trend line of the price channel on the daily chart), 0.7200 (the July 11 low), 0.6817 (the May 11 low).
Resistance levels: 0.7557 (near term resistance), 0.7790 (the 61.8% Fibonacci retracement).

