
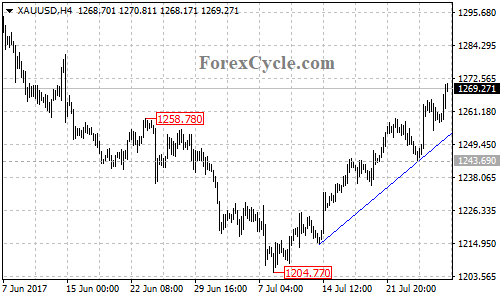
XAUUSD recently broke above 1258.78 resistance and continued its bullish movement from the July 10 low of 1204.77, and the bullish movement extended to as high as 1270.81.
On the upside
The gold price stays above a bullish trend line on its 4-hour chart, with support at around 1253, indicating that the price remains in uptrend. As long as the trend line support holds, the uptrend could be expected to continue and further rise to test the 1300 important psychological level is possible in the coming days.
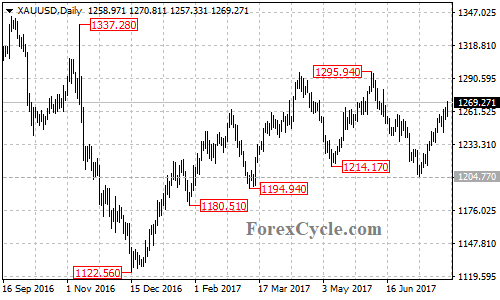
A break out of 1300 resistance will confirm that the uptrend from the December 2016 low of 1122.56 has resumed, then the following bullish move could bring price to the next resistance level at 1337.28.
On the downside
A clear break below the trend line support could bring price back to test the key support at 1243.69, below this level will signal completion of the uptrend from 1204.77, then the correction pullback could bring price back into 1230 zone.
There is another important support level at 1204.77, only a breakdown below this level will suggest that the downtrend from 1295.94 has resumed, then the gold price will find support at 1167, the trend line on its weekly chart.
Technical levels
Support levels: 1253 (the bullish trend line on the 4-hour chart), 1243.69 (the key support), 1204.77 (the July 10 low), 1167 (the support trend line on the weekly chart).
Resistance levels: 1295.94 (the June 6 high), 1300 (the important psychological level), 1337.28 (the November 2016 high), 1375.11 (the July 2016 high).