
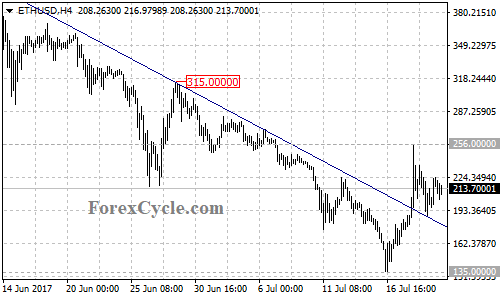
Being supported by the 20-week moving average, ETHUSD rebounded strongly from 135, and broke above the bearish trend line from the June 12 high of 415 to the June 29 high of 315 at 196 on the 4-hour chart, and reached as high as 256, suggesting that the bearish movement from 415 had completed at 135 already.
On the upside
As mentioned before, the fall from 415 would possibly be correction of the long term uptrend, and a clear break above the bearish trend line could signal resumption of the uptrend. Ethereum is expected to test 256 resistance in the coming days, a break above this level could take price to next resistance level at 315, followed by the 76.4% Fibonacci retracement taken from 415 to 135 at around 348.
On the downside
Near term support is at the resistance-turned-support trend line on the 4-hour chart now at around 180, followed by 160. The key support is at 135, only a breakdown below this level could trigger another fall towards 97, the 76.4% Fibonacci retracement taken from 0 to 415.
Technical levels
Support levels: 180 (the resistance-turned-support trend line on the 4-hour chart), 160, 135 (the July 16 low), 97 (the 76.4% Fibonacci retracement taken from 0 to 415).
Resistance levels: 256 (the July 18 high), 315 (the June 29 high), 348 (the 76.4% Fibonacci retracement taken from 415 to 135), 415 (the June 12 high).