
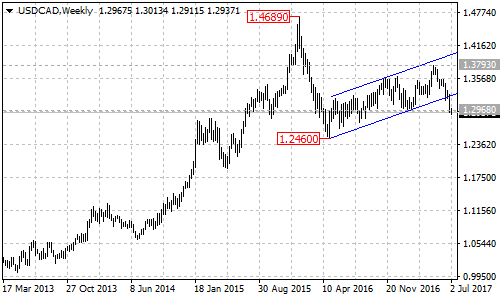
USDCAD’s bearish movement from the May 5 high of 1.3793 extended to as low as 1.2912, breaking below the January 31 low of 1.2968 key support, indicating that the long term bearish movement from the January 2016 high of 1.4689 has resumed.
On the downside
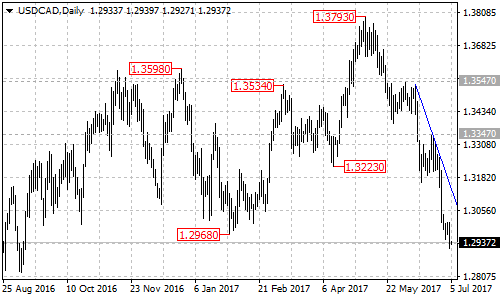
The USDCAD pair stays below a descending trend line with resistance at around 1.3135 on its daily chart. As long as the price is below the trend line, the downtrend could be expected to continue and next target would be at the 23.6% Fibonacci retracement taken from the May 2016 low of 1.2460 to 1.3793 at around 1.2775. A breakdown below this level will take price to the next support level at 1.2460.
On the upside
Near term resistance is at the trend line on the daily chart. Only a clear break above the trend line resistance will suggest that correction rebound for the bearish movement is underway, then further rally to 1.3300 area could be seen.
Technical levels
Support levels: 1.2775 (the 23.6% Fibonacci retracement), 1.2460 (the May 2016 low).
Resistance levels: 1.3135 (the trend line resistance on daily chart), 1.3300.