After breaking below the bullish trend line from 1214.17 to 1258.92 at 1270 on its 4-hour chart, XAUUSD started a bearish movement from the June 6 high of 1295.94, and the bearish movement extended to as low as 1241.25. Further decline is still possible after a minor consolidation and next target would be at around 1230.
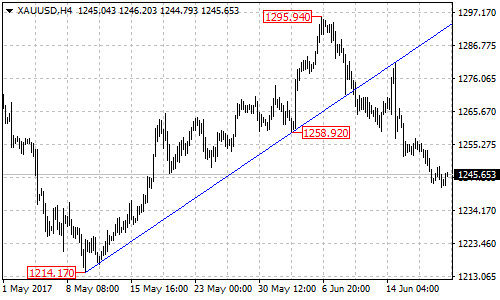
On the upside
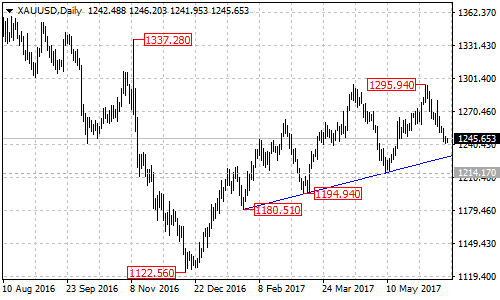
There is a bullish support trend line from the January 27 low of 1180.51 to the March 10 low of 1194.94, with support at around 1230 on its daily chart. Gold price is now heading to test the trend line support. As long as the pair is above the trend line, the pullback from 1295.94 could be treated as correction of the uptrend from the December 2016 low of 1122.56, and strong rebound could be expected after touching the trend line support. Near term resistance 1260, a break of this level could signal completion of the correction pullback, and this could trigger another bullish movement towards 1400.
On the downside
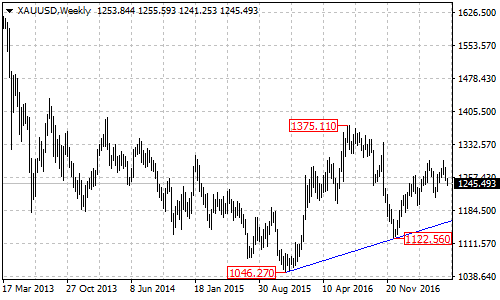
If the trend line on the daily chart gives way, the Gold price could be expected to test the next support level at the May 9 low of 1214.17. A breakdown below this level will confirm that the uptrend from 1122.56 had completed at 1295.94 already, then the following downside movement could bring price into 1160 zone. There is also an ascending trend line from the November 2015 low of 1046.27 to 1122.56, providing support at around 1160.
Technical levels
Support levels: 1230 (the trend line support on daily chart), 1214.17 (the May 9 low), 1180.51 (the January 27 low), 1122.56 (the December 2016 low), 1160 (the trend line support on weekly chart).
Resistance levels: 1260 (near term resistance), 1295.94 (the June 6 high), 1337.28 (November 2016 high), 1375.11 (July 2016 high).