
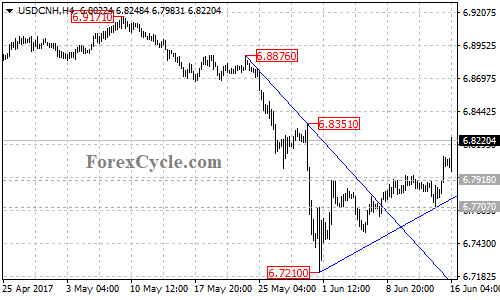
After breaking above the bearish trend line from 6.8876 to 6.8351 on its 4-hour chart, the USDCNH pair continued to break above the major resistance at the June 2 high of 6.7918, and is now trades in 6.8200 area, indicating that the bearish movement from the May 9 high of 6.9171 had completed at 6.7210 already.
On the upside
Let’s look into a big picture. USDCNH recently rebounded away from the bottom support trend line of the price channel on its weekly chart, suggesting that the consolidation pullback from the January 3 high of 6.9867 is complete.
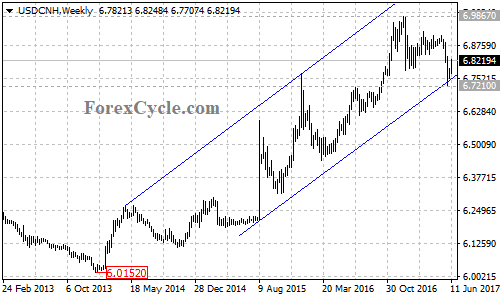
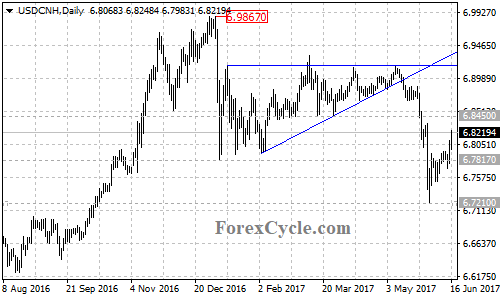
The pair is expected to test the next key resistance of the March 15 low of 6.8450 in the coming days, a break through this level will confirm that the long term bullish movement from the January 2014 low of 6.0152 has resumed, this could trigger another strong move towards the psychologically important 7.0000 level. Near term support is at the ascending trend line from 6.7210 to 6.7707 now at around 6.7770 on its 4-hour chart, followed by 6.7707, as long as these levels hold, the uptrend will continue.
On the downside
However, as long as the pair is below 6.8450 resistance, the rise from 6.7210 would possibly be correction of the downtrend from the May 9 high, and another fall towards 6.6500 is still possible after the correction.
Technical levels
Support levels: 6.7770 (the ascending trend line on 4-hour chart), 6.7707 (June 14 low), 6.7210 (June 1 low).
Resistance levels: 6.8450 (the March 15 low), 6.9170 (the top of the triangle pattern on daily chart), 6.9867 (the January 3 high).