
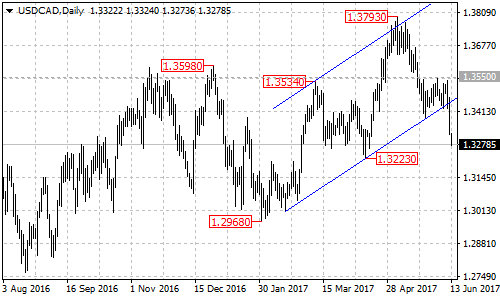
USDCAD broke below the bottom trend line at 1.3435 of the price channel on its daily chart, suggesting that the uptrend started from the January 31 low of 1.2968 had completed at the May 5 high of 1.3793 already.
On the downside
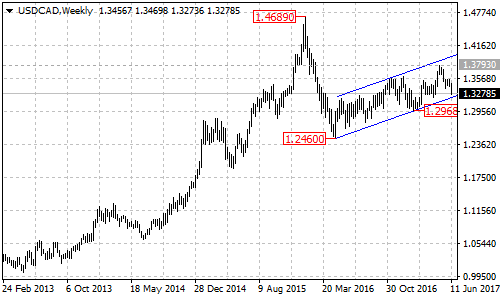
The USDCAD pair is expected to find its first support at the bottom trend line from the May 2016 low of 1.2460 to the January 31 low of 1.2968 of the price channel on its weekly chart, now at around 1.3200, a clear break below the channel support will take price to the next support level at 1.2968, below this level will confirm that the whole uptrend from 1.2460 had completed at 1.3793 already, this could trigger another long term bearish movement towards 1.1500.
On the upside
As long as the price is in the bullish price channel on the weekly chart, the USDCAD pair remains in bullish structure. As long as the channel support holds, the fall from 1.3793 could possibly be correction of the uptrend from 1.2460 and one more rise towards 1.4000 is still possible after the correction. There is a key resistance located at 1.3550 on the daily chart, a break through this level could signal resumption of the uptrend.
Technical levels
Support levels: 1.3223 (April 13 low), 1.3200 (the bottom trend line of the price channel on weekly chart), 1.2968 (January 31 low), 1.2460 (May 2016 low).
Resistance levels: 1.3550 (the key resistance on daily chart), 1.3793 (May 5 high).