After breaking below the triangle pattern on its daily chart, USDCNH dropped sharply to as low as 6.8010. Now the pair stays in a descending price channel on its 4-hour chart, indicating that the pair remains in the downtrend from the May 9 high of 6.9171. As long as the pair is in the channel, the price action from 6.8010 could be treated as consolidation of the downtrend.
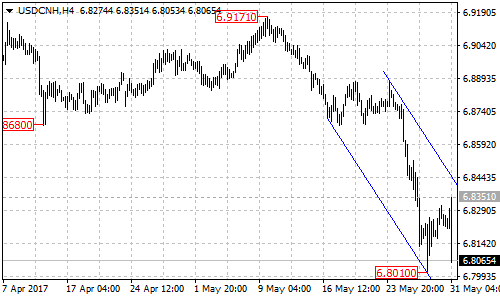
On the downside
Near term resistance is at 6.8351, followed by the top trend line of the price channel now at around 6.8440. As long as the channel resistance holds, the downtrend could be expected to continue after the consolidation. Near term support is at 6.8010, a breakdown below this level could signal resumption of the downtrend, this could trigger another fall to test the support of January 5 low of 6.7817.
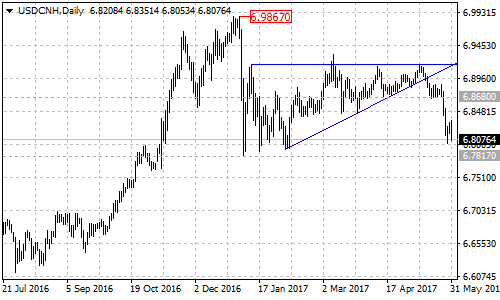
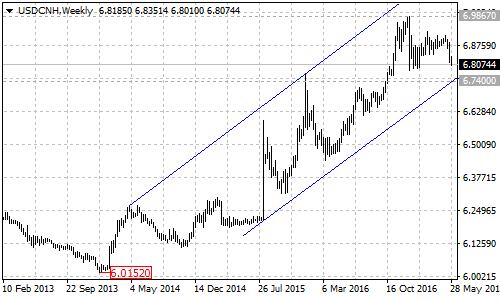
There is an important support level at 6.7817 we can see on the daily chart, a break through this level could take price to the next support level around 6.7400 which is at the bottom support trend line of the price channel on the weekly chart. Strong rebound could be seen after touching the bottom of the channel.
On the upside
A clear break of the top of the price channel on the 4-hour chart will suggest that the downtrend from 6.9171 had competed at 6.8010 already, then the following bullish movement could bring price back into 6.9000 zone.
Technical levels
Support levels: 6.8010 (near term support), 6.7817 (Jan 5 low), 6.7400 (the bottom of the price channel on weekly chart).
Resistance levels: 6.8351 (near term resistance), 6.8440 (the top of the price channel on 4-hour chart).