
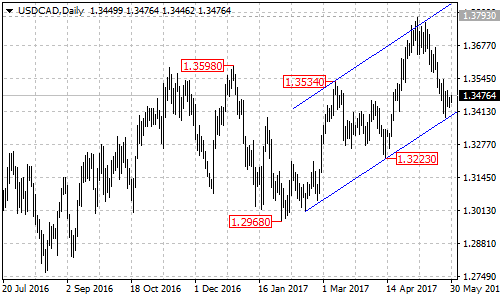
USDCAD has reached the bottom trend line of the ascending price channel on its daily chart which acts as support for the upside movement. As long as the price is above the bottom trend line, the pair remains in bullish structure and the fall from May 5 high of 1.3793 could be treated as correction of the uptrend from January 31 low of 1.2968, another rise towards 1.4000 could be expected after the correction. All we should do now is to wait for the breakout to occur.
The upside breakout
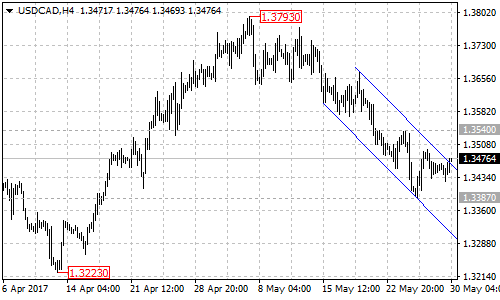
On the 4-hour chart, there is a descending price channel which provides resistance at the top trend line. A clear break out of the channel resistance could take price to the next resistance level of 1.3540 which acts as the key resistance to the correction of the short term downtrend from 1.3793. Above this level will indicate that the downtrend had completed at 1.3387 already, this could signal resumption of the uptrend from 1.2968 and the target for this uptrend would be at the top of the channel.
The downside breakout
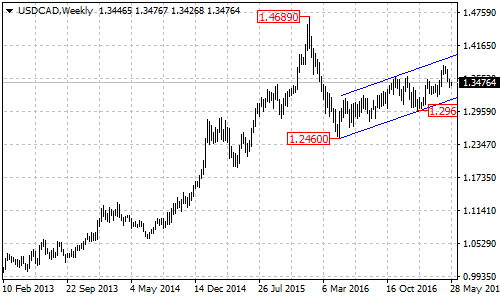
On the downside, a clear break below the support trend line of channel on the daily chart will suggest that the uptrend from 1.2968 had completed at 1.3793 already, then deeper decline could be seen, and the target would be at the bottom of the price channel on its weekly chart now at around 1.3180.
Technical levels
Support levels: 1.3380 (the bottom of the price channel on daily chart), 1.3180 (the bottom of the price channel on weekly chart).
Resistance levels: 1.3470 (the top of the price channel on 4-hour chart), 1.3540 (the key resistance for the short term downtrend), 1.3793 (May 5 high), the top of the price channel on daily chart.