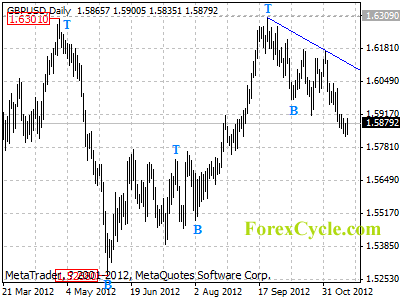
GBPUSD continues its downward movement from 1.6309, and the fall extends to as low as 1.5827. Further decline is still possible after consolidation, and next target would be at 1.5700 area. Key resistance remains at the downward trend line on daily chart, only a a clear break above the trend line resistance could signal completion of the downtrend.
For long term analysis, GBPUSD formed a sideways consolidation in a range between 1.5236 (Jan 13 low) and 1.6745 (Apr 28, 2011 high). Further rise to test 1.6745 resistance would likely be seen over the next several weeks.


