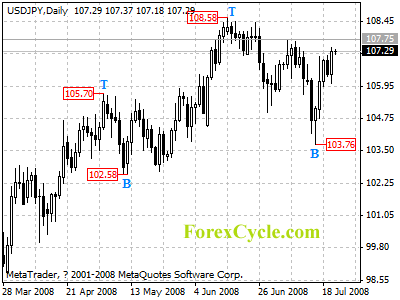
USDJPY is forming a cycle bottom at 103.76 on daily chart. Key resistance is located at 107.75, a break above this level will confirm the cycle bottom, and further rise above 108.58 previous high resistance is expected to follow. Initial support is at 103.76, only fall below this level will pull price back to 100.00 area.
For long term analysis, USDJPY might be forming a long term cycle top at 108.58 on weekly chart. However, a break below 102.58 long term key support is needed to confirm the cycle top.


