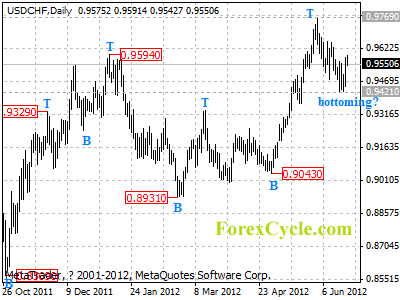
USDCHF may be forming a cycle bottom at 0.9421 on daily chart. Key resistance is at 0.9600, a break above this level will indicate that the uptrend from 0.8931 has resumed, then further rise towards 1.0000 could be seen. Support is at 0.9421, only break below this level could trigger another fall to 0.9200 area.
For long term analysis, USDCHF has formed a cycle bottom at 0.8931 on weekly chart. Further rise towards 1.0000 would likely be seen over next several weeks.


