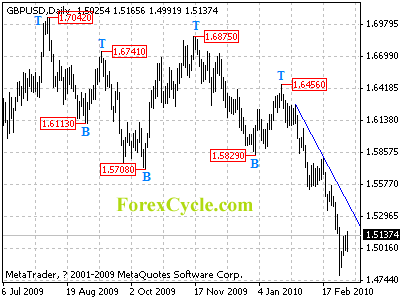
GBPUSD stays below a falling trend line on daily chart and remains in downtrend from 1.6456. As long as the trend line resistance holds, downtrend could be expected to continue and deeper decline to 1.4600 area is possible. However, next cycle bottom on daily chart is nearing, a clear break above the trend line resistance could indicate that a cycle bottom has been formed and the fall from 1.6456 has completed.
For long term analysis, GBPUSD is in bearish movement from 1.7042. Move to 1.4500 area is expected in next several weeks.


