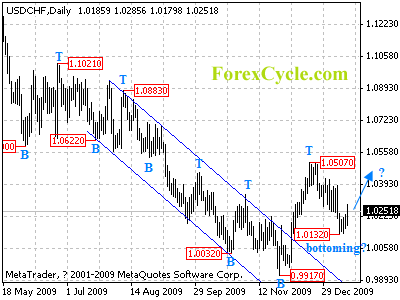
USDCHF might be forming a cycle bottom at 1.0132 level on daily chart. Key resistance is located at 1.0420, a break above this level will confirm the cycle bottom, then another rise towards 1.0600-1.0700 could be seen. Support level is at 1.0132, only fall below this level could signal deeper decline to 1.0000-1.0050 area.
For long term analysis, USDCHF has formed a cycle bottom at 0.9917 level on weekly chart. Bounce towards 1.0700 to reach next cycle top is expected.


