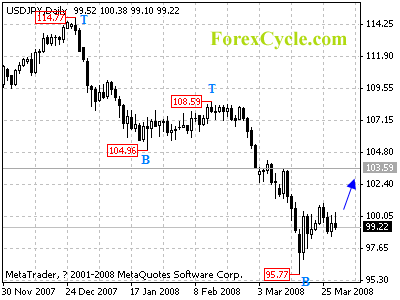
USDJPY formed a cycle bottom at 95.77 level on daily chart. Further rebound to 102.50 area to reach the next cycle top on daily chart is still possible in the next several days. Key support is at 95.77, only break of this level will signal the resumption of the long term down trend.
For long term analysis, USDJPY broke below the long term support at 101.65 (Jan 2005 low). Further fall to 90.00 area to reach the next cycle bottom on weekly chart is still in favor.
Open a Free Demo Forex Account