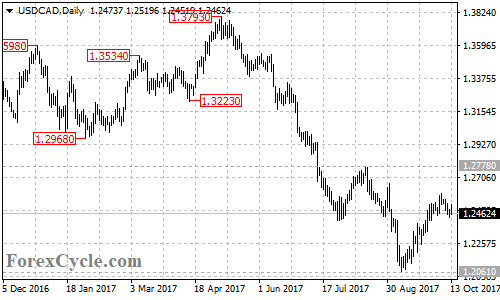
USDCAD is forming a sideways movement in a trading range between 1.2061 and 1.2778. As long as 1.2778 key resistance holds, the sideways movement could be treated as consolidation of the downtrend from 1.3793 and another fall towards 1.1600 is still possible after the consolidation. On the upside, a breakout of 1.2778 resistance will indicate that the downtrend had completed at 1.2061 already, then following bullish movement could take price back to 1.3200 area.