
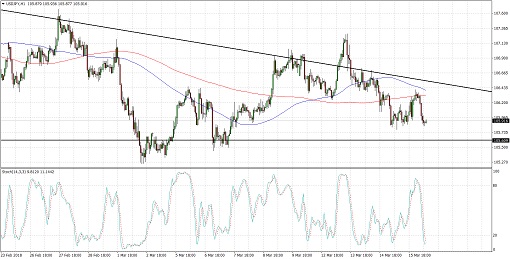
USDJPY has formed lower highs and found support at the 105.60 level, creating a descending triangle pattern on its 1-hour time frame. Price just bounced off resistance and could be due for a test of support soon.
The 100 SMA is above the longer-term 200 SMA for now but the gap has narrowed enough to signal a likely downward crossover. This could draw more sellers in and possibly even lead to a break of the triangle support.
Stochastic is already indicating oversold conditions, though, so a bounce is also possible. However, since price is nearing the peak of the formation, it could also make sense to wait for a breakout instead. The chart pattern is around 200 pips tall so the resulting rally or selloff could be of the same height.
The dollar gained some support in recent sessions due to mostly upbeat data, but it was still only second to the yen in terms of being a top performer. There have been no major reports out of Japan but it seems that traders prefer the yen as a safe-haven bet.
Nonetheless, it’s worth nothing that the FOMC decision is coming up next week so traders must also be pricing in their expectations for an interest rate hike. Still, any protectionist remarks from Trump tend to inspire a flight to safety, which tends to be more positive for JPY than the dollar.
By Kate Curtis from Trader’s Way